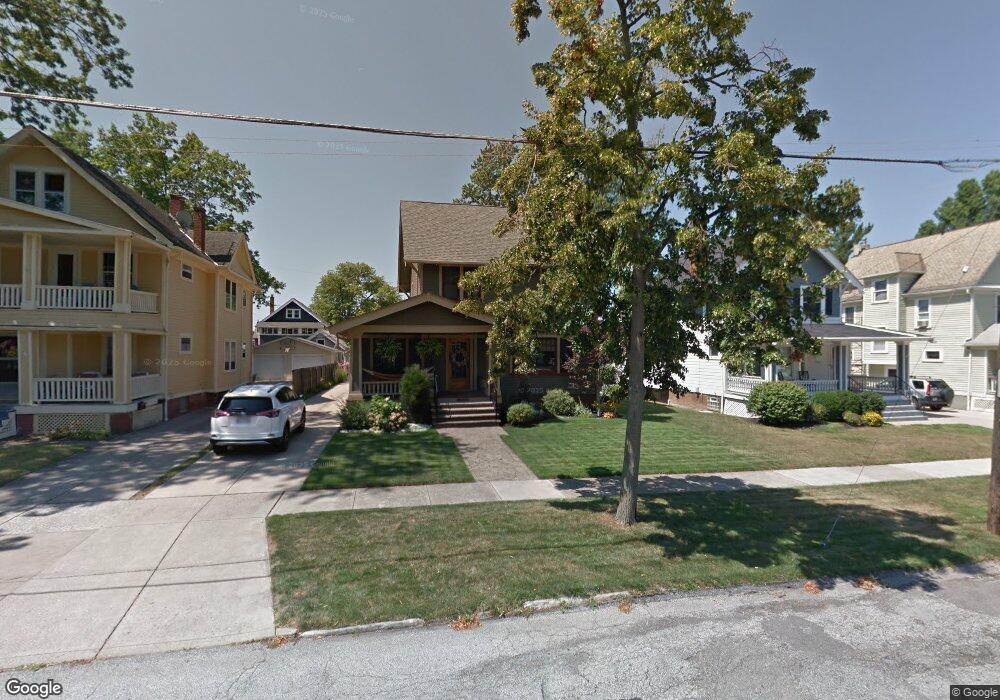
1570 Mars Ave Lakewood, OH 44107
Estimated Value: $334,000 - $423,000
3
Beds
1
Bath
1,734
Sq Ft
$213/Sq Ft
Est. Value
About This Home
This home is located at 1570 Mars Ave, Lakewood, OH 44107 and is currently estimated at $369,698, approximately $213 per square foot. 1570 Mars Ave is a home located in Cuyahoga County with nearby schools including Grant Elementary School, Harding Middle School, and Lakewood High School.
Ownership History
Date
Name
Owned For
Owner Type
Purchase Details
Closed on
Aug 19, 1998
Sold by
Sweet Kevin W and Sweet Karen E
Bought by
Jacobson David Thomas
Current Estimated Value
Home Financials for this Owner
Home Financials are based on the most recent Mortgage that was taken out on this home.
Original Mortgage
$103,600
Outstanding Balance
$21,745
Interest Rate
6.99%
Estimated Equity
$347,953
Purchase Details
Closed on
Jun 15, 1995
Sold by
Myers Robert J
Bought by
Sweet Kevin W and Sweet Karen E
Home Financials for this Owner
Home Financials are based on the most recent Mortgage that was taken out on this home.
Original Mortgage
$96,750
Interest Rate
8.27%
Mortgage Type
New Conventional
Purchase Details
Closed on
Oct 24, 1978
Sold by
Thompson Kathleen A
Bought by
Myers Robert J
Purchase Details
Closed on
Dec 8, 1975
Sold by
Evanoff Steve M
Bought by
Thompson Kathleen A
Purchase Details
Closed on
Jan 1, 1975
Bought by
Evanoff Steve M
Create a Home Valuation Report for This Property
The Home Valuation Report is an in-depth analysis detailing your home's value as well as a comparison with similar homes in the area
Home Values in the Area
Average Home Value in this Area
Purchase History
| Date | Buyer | Sale Price | Title Company |
|---|---|---|---|
| Jacobson David Thomas | $129,500 | Acs Title | |
| Sweet Kevin W | $107,500 | -- | |
| Myers Robert J | $51,000 | -- | |
| Thompson Kathleen A | $35,000 | -- | |
| Evanoff Steve M | -- | -- |
Source: Public Records
Mortgage History
| Date | Status | Borrower | Loan Amount |
|---|---|---|---|
| Open | Jacobson David Thomas | $103,600 | |
| Previous Owner | Sweet Kevin W | $96,750 |
Source: Public Records
Tax History Compared to Growth
Tax History
| Year | Tax Paid | Tax Assessment Tax Assessment Total Assessment is a certain percentage of the fair market value that is determined by local assessors to be the total taxable value of land and additions on the property. | Land | Improvement |
|---|---|---|---|---|
| 2024 | $6,559 | $102,130 | $23,940 | $78,190 |
| 2023 | $5,974 | $79,590 | $18,270 | $61,320 |
| 2022 | $6,012 | $79,590 | $18,270 | $61,320 |
| 2021 | $5,950 | $79,590 | $18,270 | $61,320 |
| 2020 | $5,278 | $61,710 | $14,180 | $47,530 |
| 2019 | $5,173 | $176,300 | $40,500 | $135,800 |
| 2018 | $5,166 | $61,710 | $14,180 | $47,530 |
| 2017 | $4,377 | $47,500 | $10,920 | $36,580 |
| 2016 | $4,276 | $46,730 | $10,920 | $35,810 |
| 2015 | $4,280 | $46,730 | $10,920 | $35,810 |
| 2014 | $4,280 | $44,940 | $10,500 | $34,440 |
Source: Public Records
Map
Nearby Homes
- 1578 Mars Ave
- 1594 Victoria Ave
- 15555 Hilliard Rd Unit 401A
- 1617 Westwood Ave
- 1542 Westwood Ave
- 1547 Orchard Grove Ave
- 1480 Warren Rd Unit 313
- 1480 Warren Rd
- 1507 Orchard Grove Ave
- 1431 Northland Ave
- 2099 Olive Ave
- 1563 Wagar Ave
- 1615 Wagar Ave
- 1593 Marlowe Ave
- 1545 Marlowe Ave
- 1437 Woodward Ave
- 14924 Arden Ave
- 14909 Arden Ave
- 1337 Cook Ave
- 2165 Arthur Ave
- 1574 Mars Ave
- 1576 Mars Ave
- 1566 Mars Ave
- 1562 Mars Ave
- 1575 Arthur Ave
- 1556 Mars Ave
- 1577 Arthur Ave
- 1569 Arthur Ave
- 15406 Hilliard Rd
- 15232 Hilliard Rd
- 1563 Arthur Ave
- 1583 Arthur Ave
- 1550 Mars Ave
- 1587 Arthur Ave
- 1557 Arthur Ave
- 15228 Hilliard Rd
- 1567 Mars Ave
- 1589 Mars Ave
- 1553 Arthur Ave
- 1546 Mars Ave