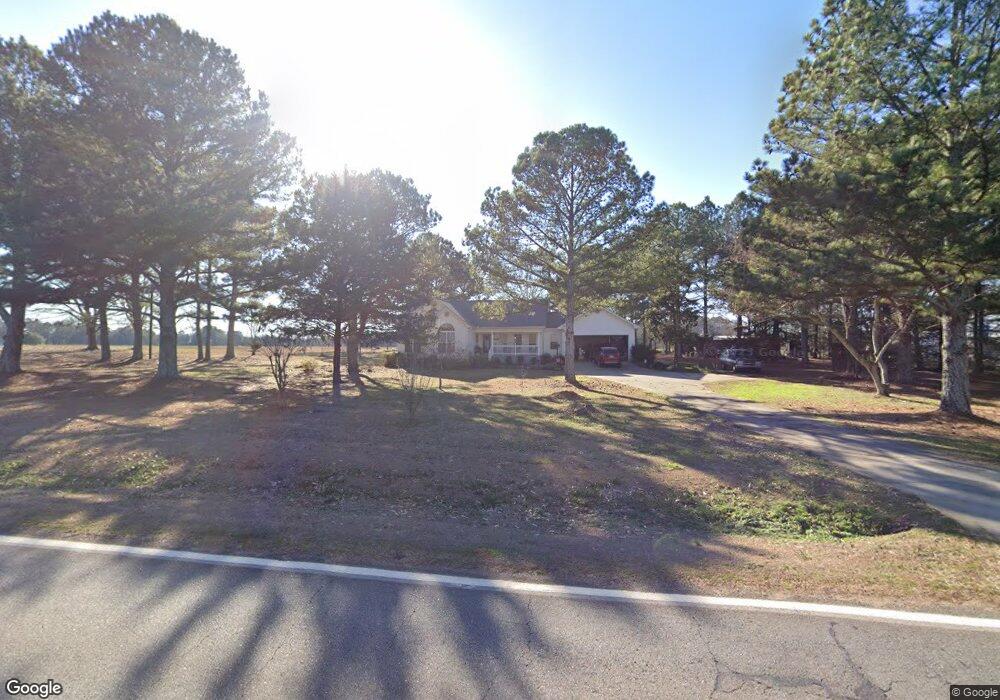
1570 Price Mill Rd Bishop, GA 30621
Estimated Value: $308,498 - $428,000
3
Beds
2
Baths
1,517
Sq Ft
$240/Sq Ft
Est. Value
About This Home
This home is located at 1570 Price Mill Rd, Bishop, GA 30621 and is currently estimated at $363,375, approximately $239 per square foot. 1570 Price Mill Rd is a home located in Morgan County with nearby schools including Morgan County Primary School, Morgan County Elementary School, and Morgan County Middle School.
Ownership History
Date
Name
Owned For
Owner Type
Purchase Details
Closed on
Jan 24, 2008
Sold by
Cruce Sandra
Bought by
Satterfield Sandra
Current Estimated Value
Purchase Details
Closed on
Jun 22, 2005
Sold by
Crider Sandra Kay
Bought by
Cruce Sandra
Home Financials for this Owner
Home Financials are based on the most recent Mortgage that was taken out on this home.
Original Mortgage
$120,000
Interest Rate
8.3%
Mortgage Type
New Conventional
Purchase Details
Closed on
Apr 27, 2005
Sold by
Crider Danny Glenn
Bought by
Crider Sandra Kay
Home Financials for this Owner
Home Financials are based on the most recent Mortgage that was taken out on this home.
Original Mortgage
$120,000
Interest Rate
8.3%
Mortgage Type
New Conventional
Purchase Details
Closed on
Jun 7, 2004
Sold by
Crider Sandra
Bought by
Crider Danny
Purchase Details
Closed on
Feb 13, 2004
Sold by
Ghann Thomas H
Bought by
Crider Sandra
Purchase Details
Closed on
Jan 10, 2003
Sold by
Georgia General Facilities Llc
Bought by
Ghann Thomas H
Create a Home Valuation Report for This Property
The Home Valuation Report is an in-depth analysis detailing your home's value as well as a comparison with similar homes in the area
Home Values in the Area
Average Home Value in this Area
Purchase History
| Date | Buyer | Sale Price | Title Company |
|---|---|---|---|
| Satterfield Sandra | -- | -- | |
| Cruce Sandra | -- | -- | |
| Crider Sandra Kay | -- | -- | |
| Crider Danny | -- | -- | |
| Crider Sandra | $132,000 | -- | |
| Ghann Thomas H | $28,000 | -- |
Source: Public Records
Mortgage History
| Date | Status | Borrower | Loan Amount |
|---|---|---|---|
| Previous Owner | Cruce Sandra | $120,000 |
Source: Public Records
Tax History Compared to Growth
Tax History
| Year | Tax Paid | Tax Assessment Tax Assessment Total Assessment is a certain percentage of the fair market value that is determined by local assessors to be the total taxable value of land and additions on the property. | Land | Improvement |
|---|---|---|---|---|
| 2024 | $1,975 | $94,832 | $17,865 | $76,967 |
| 2023 | $1,789 | $84,620 | $16,078 | $68,542 |
| 2022 | $1,496 | $73,143 | $10,719 | $62,424 |
| 2021 | $1,490 | $72,645 | $10,221 | $62,424 |
| 2020 | $1,665 | $69,171 | $9,292 | $59,879 |
| 2019 | $1,692 | $69,171 | $9,292 | $59,879 |
| 2018 | $1,638 | $66,066 | $9,292 | $56,774 |
| 2017 | $1,793 | $66,158 | $9,292 | $56,866 |
| 2016 | $1,565 | $61,136 | $9,200 | $51,936 |
| 2015 | $1,511 | $58,380 | $6,400 | $51,980 |
| 2014 | $1,337 | $53,300 | $5,600 | $47,700 |
| 2013 | -- | $40,304 | $5,600 | $34,704 |
Source: Public Records
Map
Nearby Homes
- 1670 Price Mill Rd
- 5251 Bostwick Hwy
- 5921 Bostwick Rd
- 4660 Fairplay Rd
- 1350 Echols Rd
- LOT 24 Apalachee Rd
- 0 Mt Vernon Rd Unit 7601782
- 0 Mt Vernon Rd Unit 10548484
- 3171 Wagnon Mill Rd
- 1560 Beaver Dam Rd
- 1700 Beaver Dam Rd
- 1501 Launius Rd
- LOT 3 Mallory Rd
- 1971 Macon Hwy
- LOT 13 Wallace Rd
- LOT 8 Wallace Rd
- LOT 14 Wallace Rd
- LOT 12 Wallace Rd
- 1590 Price Mill Rd
- 1600 Price Mill Rd
- 1620 Price Mill Rd
- 1210 Ruark Ln
- 1640 Price Mill Rd
- 0 Price Mill Rd Unit 7191220
- 1661 Price Mill Rd
- 1200 Ruark Ln
- 1551 Price Mill Rd
- 1650 Price Mill Rd
- 1540 Price Mill Rd
- 1567 Price Mill Rd
- 1191 Ruark Ln
- 1511 Price Mill Rd
- 1541 Price Mill Rd
- 1500 Price Mill Rd
- 1545 Price Mill Rd
- 1545 Price Mill Rd
- 1569 Price Mill Rd
- 1511 Price Mill Rd