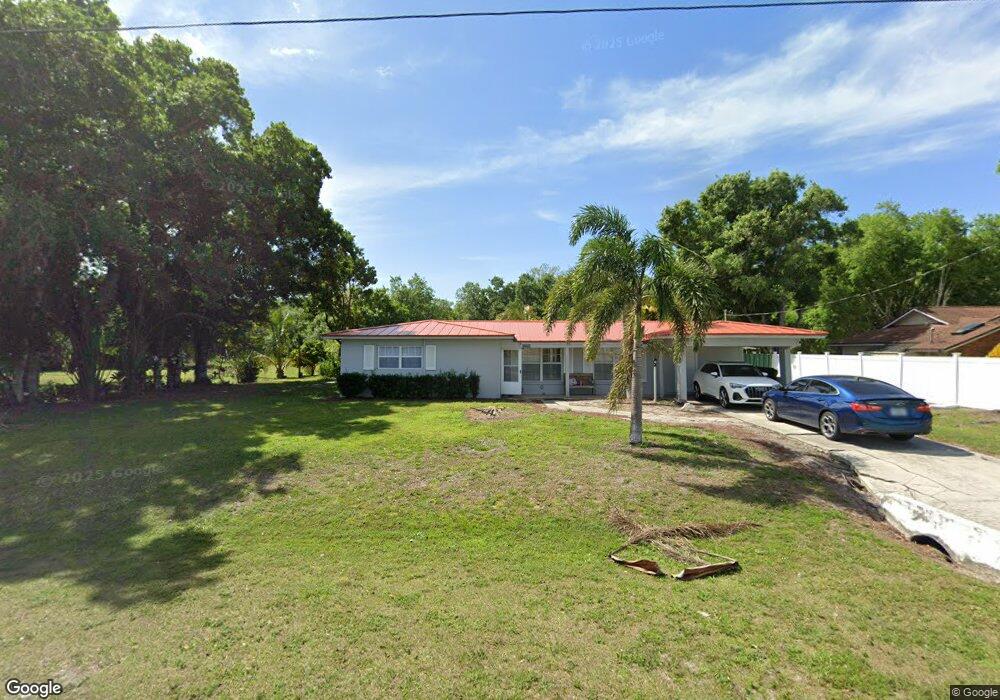
15700 SW Famel Blvd Indiantown, FL 34956
Estimated Value: $249,391 - $438,000
3
Beds
3
Baths
1,630
Sq Ft
$212/Sq Ft
Est. Value
About This Home
This home is located at 15700 SW Famel Blvd, Indiantown, FL 34956 and is currently estimated at $345,348, approximately $211 per square foot. 15700 SW Famel Blvd is a home located in Martin County with nearby schools including Warfield Elementary School, Indiantown Middle School, and South Fork High School.
Ownership History
Date
Name
Owned For
Owner Type
Purchase Details
Closed on
May 2, 2022
Sold by
Lasso Mazuera Juan Carlos
Bought by
Nicolas Luis and Perez Sandy
Current Estimated Value
Purchase Details
Closed on
Mar 31, 2017
Sold by
Henrickson Alice
Bought by
Lasso Juan Carlos
Home Financials for this Owner
Home Financials are based on the most recent Mortgage that was taken out on this home.
Original Mortgage
$134,518
Interest Rate
4.12%
Mortgage Type
FHA
Purchase Details
Closed on
Feb 28, 2011
Sold by
Henrickson Alice
Bought by
Henrickson Alice
Purchase Details
Closed on
Apr 28, 2010
Sold by
U S Bank National Association
Bought by
Henrickson Alice
Purchase Details
Closed on
Nov 10, 2009
Sold by
Tabor Darla S and Case #43-2008-Ca-002445
Bought by
U S Bank National Association
Create a Home Valuation Report for This Property
The Home Valuation Report is an in-depth analysis detailing your home's value as well as a comparison with similar homes in the area
Home Values in the Area
Average Home Value in this Area
Purchase History
| Date | Buyer | Sale Price | Title Company |
|---|---|---|---|
| Nicolas Luis | $200,000 | First International Title | |
| Lasso Juan Carlos | $137,000 | First Interantional Title In | |
| Henrickson Alice | $3,000 | -- | |
| Henrickson Alice | $73,000 | Chelsea Title Company | |
| U S Bank National Association | -- | Attorney |
Source: Public Records
Mortgage History
| Date | Status | Borrower | Loan Amount |
|---|---|---|---|
| Previous Owner | Lasso Juan Carlos | $134,518 |
Source: Public Records
Tax History Compared to Growth
Tax History
| Year | Tax Paid | Tax Assessment Tax Assessment Total Assessment is a certain percentage of the fair market value that is determined by local assessors to be the total taxable value of land and additions on the property. | Land | Improvement |
|---|---|---|---|---|
| 2025 | $3,911 | $247,453 | -- | -- |
| 2024 | $3,968 | $240,480 | $240,480 | $110,480 |
| 2023 | $3,968 | $244,360 | $244,360 | $114,360 |
| 2022 | $2,300 | $150,072 | $0 | $0 |
| 2021 | $2,278 | $145,701 | $0 | $0 |
| 2020 | $2,181 | $143,690 | $0 | $0 |
| 2019 | $2,148 | $140,459 | $0 | $0 |
| 2018 | $2,098 | $137,840 | $55,000 | $82,840 |
| 2017 | $1,760 | $120,420 | $50,000 | $70,420 |
| 2016 | $1,807 | $93,610 | $40,000 | $53,610 |
| 2015 | -- | $87,370 | $25,000 | $62,370 |
| 2014 | -- | $75,990 | $20,000 | $55,990 |
Source: Public Records
Map
Nearby Homes
- Tbd SW Famel Blvd
- 15995 SW Vine Dr
- 15995 Vine Dr
- 15340 SW Palm Dr
- 15306 SW Palm Oak Ave
- 138 SW Seminole Dr
- 14700 SW Sonora Terrace
- 14733 SW Little Indian Ave
- 14681 SW Divot Dr Unit A-11
- 14642 SW Divot Dr
- 15925 SW Indianwood Cir
- 14581 SW Divot Dr
- Piper End Unit Plan at Terra Lago - Terra Lago Townhomes
- Piper Plan at Terra Lago - Terra Lago Townhomes
- 15803 Winter Rd Unit 1E
- 15839 Winter Rd
- 14663 SW Rake Dr
- 14551 SW Divot Dr
- 14623 SW Rake Dr
- 15964 SW Indianwood Cir
- 15700 SW Famel Ave
- 15670 SW Famel Ave
- 15670 SW Famel Blvd
- 15790 SW Famel Ave
- 15850 SW Famel Ave
- 15860 SW Famel Ave
- 15760 SW Hammock Way Unit Poinciana
- 15760 SW Hammock Way Unit Sabal
- 15760 SW Hammock Way Unit Acadia
- 15760 SW Hammock Way
- 15940 SW Famel Ave
- 15775 SW Market St
- 15501 SW Famel Blvd
- 15960 SW Famel Ave
- 15650 SW Fernwood Forest Rd
- 16264 SW Pine View Ave
- 16264 SW Pineview Ave
- 15830 SW Oak St
- 0 SW Pine View Ave
- 15400 SW Oak St