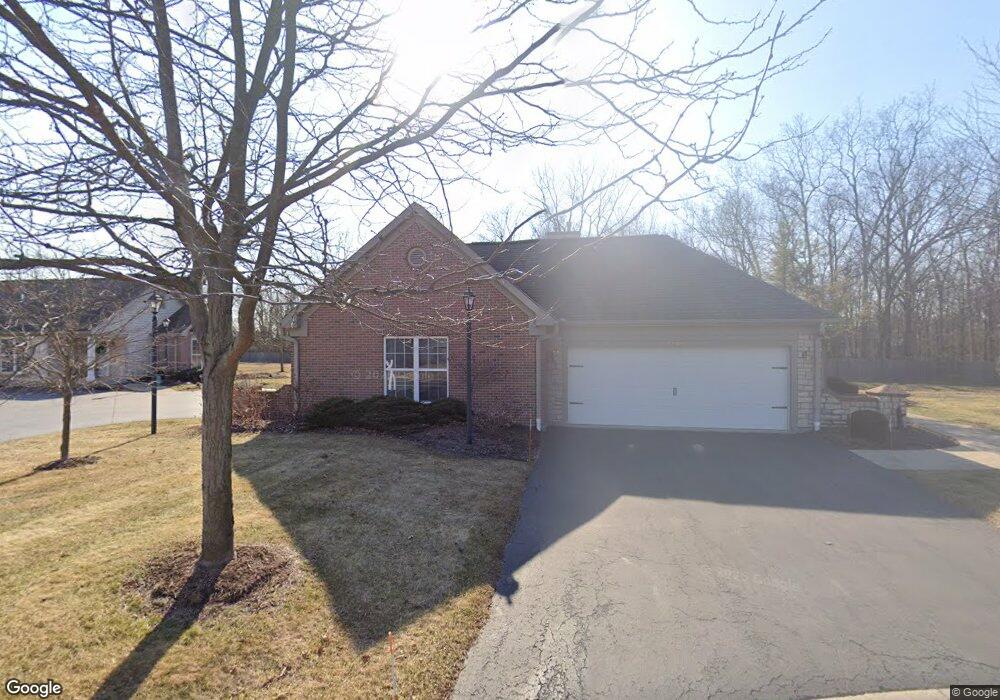
15703 Mahogany Trail Unit U11-B Findlay, OH 45840
Estimated Value: $270,000 - $290,000
2
Beds
2
Baths
1,442
Sq Ft
$197/Sq Ft
Est. Value
About This Home
This home is located at 15703 Mahogany Trail Unit U11-B, Findlay, OH 45840 and is currently estimated at $283,989, approximately $196 per square foot. 15703 Mahogany Trail Unit U11-B is a home located in Hancock County with nearby schools including Van Buren Elementary School, Van Buren Middle School, and Van Buren High School.
Ownership History
Date
Name
Owned For
Owner Type
Purchase Details
Closed on
Aug 30, 2022
Sold by
Franks Gary E and Franks Sandra K
Bought by
Tong Alan T and Tong Jane E
Current Estimated Value
Home Financials for this Owner
Home Financials are based on the most recent Mortgage that was taken out on this home.
Original Mortgage
$217,500
Outstanding Balance
$207,879
Interest Rate
5.3%
Mortgage Type
New Conventional
Estimated Equity
$76,110
Purchase Details
Closed on
Aug 29, 2022
Sold by
Tong Alan T and Tong Jane E
Bought by
Jane E Tong Revocable Trust
Home Financials for this Owner
Home Financials are based on the most recent Mortgage that was taken out on this home.
Original Mortgage
$217,500
Outstanding Balance
$207,879
Interest Rate
5.3%
Mortgage Type
New Conventional
Estimated Equity
$76,110
Purchase Details
Closed on
May 30, 2014
Sold by
Fifth Third Bank
Bought by
Franks Gary E and Franks Sandra K
Create a Home Valuation Report for This Property
The Home Valuation Report is an in-depth analysis detailing your home's value as well as a comparison with similar homes in the area
Home Values in the Area
Average Home Value in this Area
Purchase History
| Date | Buyer | Sale Price | Title Company |
|---|---|---|---|
| Tong Alan T | $290,000 | -- | |
| Jane E Tong Revocable Trust | -- | -- | |
| Franks Gary E | $155,000 | Flag City Title Agency |
Source: Public Records
Mortgage History
| Date | Status | Borrower | Loan Amount |
|---|---|---|---|
| Open | Tong Alan T | $217,500 |
Source: Public Records
Tax History Compared to Growth
Tax History
| Year | Tax Paid | Tax Assessment Tax Assessment Total Assessment is a certain percentage of the fair market value that is determined by local assessors to be the total taxable value of land and additions on the property. | Land | Improvement |
|---|---|---|---|---|
| 2024 | $2,256 | $72,250 | $3,680 | $68,570 |
| 2023 | $2,245 | $72,250 | $3,680 | $68,570 |
| 2022 | $2,246 | $72,250 | $3,680 | $68,570 |
| 2021 | $1,746 | $61,800 | $2,800 | $59,000 |
| 2020 | $1,744 | $61,800 | $2,800 | $59,000 |
| 2019 | $1,806 | $61,800 | $2,800 | $59,000 |
| 2018 | $1,830 | $61,800 | $2,800 | $59,000 |
| 2017 | $917 | $61,800 | $2,800 | $59,000 |
| 2016 | $1,789 | $61,800 | $2,800 | $59,000 |
| 2015 | $1,423 | $50,310 | $2,800 | $47,510 |
| 2014 | $1,429 | $50,310 | $2,800 | $47,510 |
| 2012 | $1,879 | $50,310 | $2,800 | $47,510 |
Source: Public Records
Map
Nearby Homes
- 15711 Mahogany Trail
- 15680 Thornwood Dr
- 7137 Township Road 212
- 7507 Township Road 212
- 7665 Brookstone Dr
- 7633 Brookstone Dr
- 0 Hickory Ln Unit 1 307878
- 0 Hickory Ln Unit 20252999
- 0 Hickory Ln Unit 6133896
- 0 E Us Route 224
- 15329 E Us Route 224
- 7711 E Watermark Dr
- 7752 E Point Dr
- 0 Forest Ln Unit 6136549
- 8100 Shawnee Forest Dr
- 6339 Township Road 243
- 16078 Forest Lake Dr
- 8405 Indian Lake Dr
- 0 Meadowview Dr
- 0 Lakeside Dr
- 15703 Mahogany Trail
- 15705 Mahogany Tr
- 15705 Mahogany Trail Unit U11
- 15703 Mahogany Tr
- 15693 Mahogany Trail
- 15690 Mahogany Trail Unit 12B
- 15690 Mahogany Trail Unit U12-B
- 15690 Mahogany Trail
- 15711 Mahogany Trail Unit U10-D
- 15713 Mahogany Trail
- 15713 Mahogany Trail Unit U10-A
- 15717 Mahogany Trail
- 15715 Mahogany Trail Unit U10-C
- 15728 Mahogany Trail
- 15728 Mahogany Tr
- 15730 Mahogany Trail
- 15682 Thornwood Dr
- 15738 Mahogany Trail
- 15683 Thornwood Dr
- 15740 Mahogany Trail Unit 16B