Estimated Value: $193,000 - $244,000
2
Beds
2
Baths
1,258
Sq Ft
$179/Sq Ft
Est. Value
About This Home
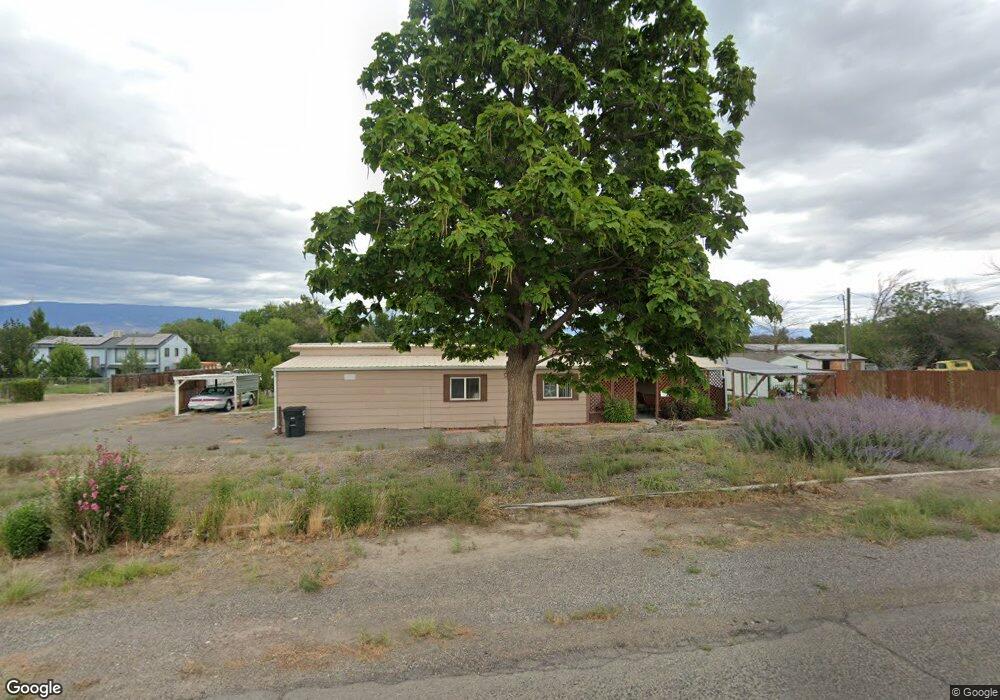
This home is located at 1571 Cherry Ln, Delta, CO 81416 and is currently estimated at $224,651, approximately $178 per square foot. 1571 Cherry Ln is a home located in Delta County with nearby schools including Garnet Mesa Elementary School, Lincoln Elementary School, and Delta Middle School.
Ownership History
Date
Name
Owned For
Owner Type
Purchase Details
Closed on
Jul 23, 2024
Sold by
Fullmer Leland T
Bought by
Fullmer Leland T and Campbell Cynthia J
Current Estimated Value
Purchase Details
Closed on
Jun 30, 2020
Sold by
Wetzel James K and Wood Nancy L
Bought by
Fullmer Leland T
Home Financials for this Owner
Home Financials are based on the most recent Mortgage that was taken out on this home.
Original Mortgage
$100,000
Interest Rate
3.2%
Mortgage Type
Commercial
Purchase Details
Closed on
Mar 19, 2018
Sold by
Stielow Mark William
Bought by
Wetzel James K and Wood Nancy L
Home Financials for this Owner
Home Financials are based on the most recent Mortgage that was taken out on this home.
Original Mortgage
$51,093
Interest Rate
4.22%
Mortgage Type
Commercial
Purchase Details
Closed on
Jun 22, 2015
Sold by
Kuta Jacqueline K
Bought by
Stielow Mark William
Create a Home Valuation Report for This Property
The Home Valuation Report is an in-depth analysis detailing your home's value as well as a comparison with similar homes in the area
Purchase History
| Date | Buyer | Sale Price | Title Company |
|---|---|---|---|
| Fullmer Leland T | -- | None Listed On Document | |
| Fullmer Leland T | $125,000 | Land Title Guarantee Company | |
| Wetzel James K | $95,000 | Heritage Title Co | |
| Stielow Mark William | $71,000 | Heritage Title |
Source: Public Records
Mortgage History
| Date | Status | Borrower | Loan Amount |
|---|---|---|---|
| Previous Owner | Fullmer Leland T | $100,000 | |
| Previous Owner | Wetzel James K | $51,093 |
Source: Public Records
Tax History
| Year | Tax Paid | Tax Assessment Tax Assessment Total Assessment is a certain percentage of the fair market value that is determined by local assessors to be the total taxable value of land and additions on the property. | Land | Improvement |
|---|---|---|---|---|
| 2024 | $213 | $3,226 | $1,564 | $1,662 |
| 2023 | $213 | $3,226 | $1,564 | $1,662 |
| 2022 | $377 | $5,848 | $3,128 | $2,720 |
| 2021 | $381 | $6,017 | $3,218 | $2,799 |
| 2020 | $387 | $6,014 | $2,860 | $3,154 |
| 2019 | $382 | $6,014 | $2,860 | $3,154 |
| 2018 | $263 | $3,991 | $2,016 | $1,975 |
| 2017 | $256 | $3,991 | $2,016 | $1,975 |
| 2016 | $263 | $4,489 | $2,229 | $2,260 |
| 2014 | -- | $3,305 | $2,428 | $877 |
Source: Public Records
Map
Nearby Homes
- 621 Elizabeth St
- 675 Veinte Dr
- 628 Veinte Dr
- 585 Elizabeth St
- 535 Labor St
- TBD E 7th St
- 688 Antelope St
- 1150 E 7th St
- 471 River Valley Ct
- 1045 &1055 E 9th
- 1045 E 7th St Unit 1045 1/2
- 1045 & 1055 E 9th St
- 1750 F50 Rd
- 1405 Pioneer Rd
- 625 Nuvue St
- 635 Nuvue St
- 511 Glen Way
- 1175 E 5th St
- 1721 Pioneer Cir
- 805 B St
Your Personal Tour Guide
Ask me questions while you tour the home.