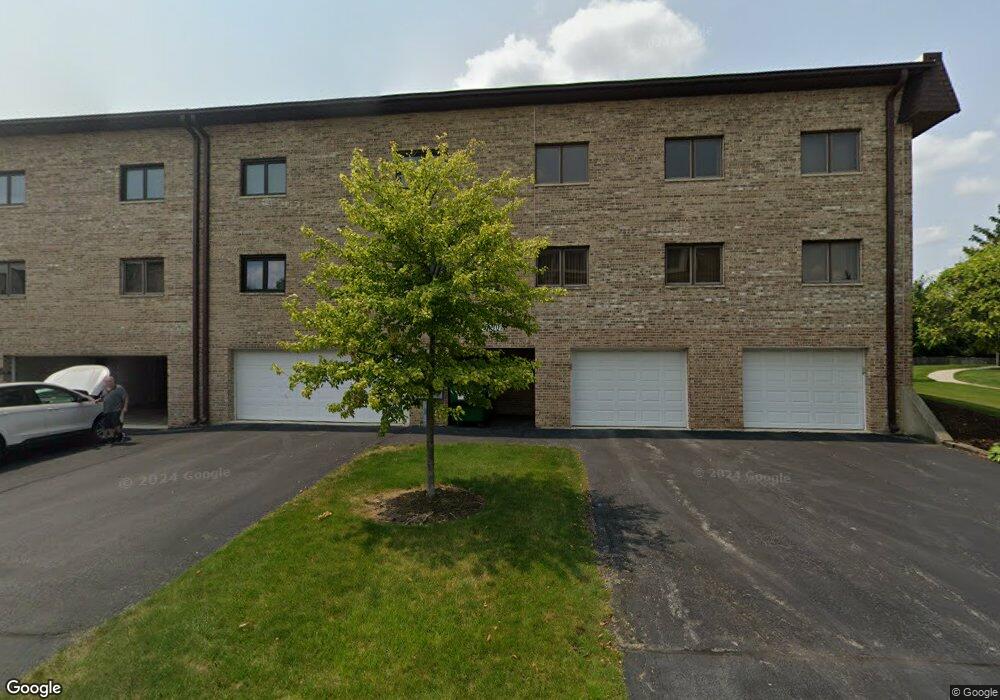
15710 Lake Hills Ct Unit 15710 Orland Park, IL 60462
Silver Lake South NeighborhoodEstimated Value: $222,049 - $264,000
2
Beds
2
Baths
1,100
Sq Ft
$224/Sq Ft
Est. Value
About This Home
This home is located at 15710 Lake Hills Ct Unit 15710, Orland Park, IL 60462 and is currently estimated at $246,512, approximately $224 per square foot. 15710 Lake Hills Ct Unit 15710 is a home located in Cook County with nearby schools including Prairie Elementary School, Liberty Elementary School, and Jerling Junior High School.
Ownership History
Date
Name
Owned For
Owner Type
Purchase Details
Closed on
Jul 12, 2016
Sold by
Meany Judy L
Bought by
Meany Judy L and Judy L Meany Family Trust
Current Estimated Value
Purchase Details
Closed on
Aug 21, 2005
Sold by
Patras Gregory L and Patras Janet
Bought by
Meany Judy L
Home Financials for this Owner
Home Financials are based on the most recent Mortgage that was taken out on this home.
Original Mortgage
$100,000
Outstanding Balance
$53,440
Interest Rate
5.93%
Mortgage Type
Fannie Mae Freddie Mac
Estimated Equity
$193,072
Purchase Details
Closed on
May 15, 2001
Sold by
Durkin Mary Dolores
Bought by
Patras Gregory L
Home Financials for this Owner
Home Financials are based on the most recent Mortgage that was taken out on this home.
Original Mortgage
$127,300
Interest Rate
7.02%
Purchase Details
Closed on
Nov 24, 1993
Sold by
Marquette National Bank
Bought by
Durkin Mary Dolores
Create a Home Valuation Report for This Property
The Home Valuation Report is an in-depth analysis detailing your home's value as well as a comparison with similar homes in the area
Home Values in the Area
Average Home Value in this Area
Purchase History
| Date | Buyer | Sale Price | Title Company |
|---|---|---|---|
| Meany Judy L | -- | None Available | |
| Meany Judy L | $177,500 | Atgf Inc | |
| Patras Gregory L | $134,000 | Ticor Title | |
| Durkin Mary Dolores | $70,333 | -- |
Source: Public Records
Mortgage History
| Date | Status | Borrower | Loan Amount |
|---|---|---|---|
| Open | Meany Judy L | $100,000 | |
| Previous Owner | Patras Gregory L | $127,300 |
Source: Public Records
Tax History Compared to Growth
Tax History
| Year | Tax Paid | Tax Assessment Tax Assessment Total Assessment is a certain percentage of the fair market value that is determined by local assessors to be the total taxable value of land and additions on the property. | Land | Improvement |
|---|---|---|---|---|
| 2024 | $2,579 | $16,274 | $1,482 | $14,792 |
| 2023 | $1,768 | $16,274 | $1,482 | $14,792 |
| 2022 | $1,768 | $12,060 | $1,304 | $10,756 |
| 2021 | $1,754 | $12,058 | $1,303 | $10,755 |
| 2020 | $1,803 | $12,058 | $1,303 | $10,755 |
| 2019 | $1,036 | $9,949 | $1,185 | $8,764 |
| 2018 | $1,739 | $9,949 | $1,185 | $8,764 |
| 2017 | $1,715 | $9,949 | $1,185 | $8,764 |
| 2016 | $1,808 | $8,975 | $1,066 | $7,909 |
| 2015 | $1,755 | $8,975 | $1,066 | $7,909 |
| 2014 | $1,744 | $8,975 | $1,066 | $7,909 |
| 2013 | $2,402 | $12,000 | $1,066 | $10,934 |
Source: Public Records
Map
Nearby Homes
- 15724 Old Orchard Ct Unit 1W
- 15636 Chapel Hill Rd
- 15624 Sunset Ridge Dr
- 15702 Deerfield Ct Unit 2S
- 15712 86th Ave Unit 117
- 16011 84th Place Unit 16011
- 15717 Orlan Brook Dr Unit G83
- 15817 Orlan Brook Dr Unit 35
- 8534 Westberry Ln Unit 8534
- 16001 Eagle Ridge Dr Unit 1S
- 15713 Orlan Brook Dr Unit 98
- 15826 Orlan Brook Dr Unit 3S
- 15726 Orlan Brook Dr Unit 193
- 16037 Eagle Ridge Dr Unit 3N
- 15426 S 82nd Ave
- 8624 Kendall Ln
- 16122 Pine Dr Unit 2476
- 15713 Brassie Ct Unit 1S
- 15633 Orlan Brook Dr
- 8040 160th St Unit 8040
- 15710 Lake Hills Ct Unit 15710
- 15710 Lake Hills Ct Unit 15710
- 15710 Lake Hills Ct Unit 15710
- 15710 Lake Hills Ct Unit 2N
- 15710 Lake Hills Ct Unit 1N
- 15710 Lake Hills Ct Unit 1S
- 15712 Lake Hills Ct Unit 1S
- 15712 Lake Hills Ct Unit 15712
- 15712 Lake Hills Ct Unit 15712
- 15712 Lake Hills Ct Unit 15712
- 15712 Lake Hills Ct Unit 15712
- 15712 Lake Hills Ct Unit 2S
- 15712 Lake Hills Ct Unit 2N
- 15712 Lake Hills Ct Unit 1N
- 15714 Lake Hills Ct Unit 15714
- 15714 Lake Hills Ct Unit 15714
- 15714 Lake Hills Ct Unit 15714
- 15714 Lake Hills Ct Unit 15714
- 15714 Lake Hills Ct Unit 1S
- 15700 Lake Hills Ct Unit 2N