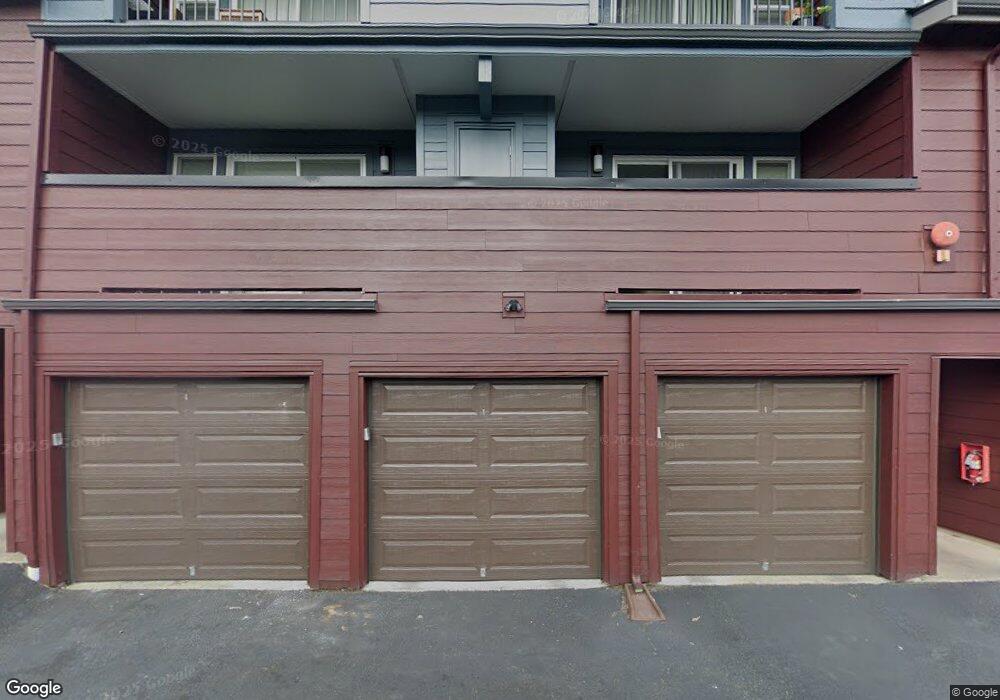
15711 Waynita Way NE Unit H208 Bothell, WA 98011
Norway Hill NeighborhoodEstimated Value: $485,000 - $503,000
2
Beds
3
Baths
1,029
Sq Ft
$479/Sq Ft
Est. Value
About This Home
This home is located at 15711 Waynita Way NE Unit H208, Bothell, WA 98011 and is currently estimated at $492,615, approximately $478 per square foot. 15711 Waynita Way NE Unit H208 is a home located in King County with nearby schools including Moorlands Elementary School, Northshore Junior High School, and Inglemoor High School.
Ownership History
Date
Name
Owned For
Owner Type
Purchase Details
Closed on
Sep 20, 2011
Sold by
Federal Home Loan Mortgage Corporation
Bought by
Cats Kari Louise
Current Estimated Value
Home Financials for this Owner
Home Financials are based on the most recent Mortgage that was taken out on this home.
Original Mortgage
$131,577
Outstanding Balance
$89,063
Interest Rate
4.02%
Mortgage Type
FHA
Estimated Equity
$403,552
Purchase Details
Closed on
Apr 14, 2011
Sold by
Page Paige
Bought by
Federal Home Loan Mortgage Corp
Purchase Details
Closed on
Aug 28, 1996
Sold by
Robertson Kathleen and Sprague Patrick Carlyle
Bought by
Page Paige
Home Financials for this Owner
Home Financials are based on the most recent Mortgage that was taken out on this home.
Original Mortgage
$98,100
Interest Rate
8.23%
Purchase Details
Closed on
Oct 12, 1992
Sold by
Regent Wood Associates
Bought by
Robertson Pamela E and Robertson Kathleen M
Create a Home Valuation Report for This Property
The Home Valuation Report is an in-depth analysis detailing your home's value as well as a comparison with similar homes in the area
Home Values in the Area
Average Home Value in this Area
Purchase History
| Date | Buyer | Sale Price | Title Company |
|---|---|---|---|
| Cats Kari Louise | -- | First American | |
| Federal Home Loan Mortgage Corp | $193,000 | Northwest Title | |
| Page Paige | $109,000 | Chicago Title Insurance Co | |
| Robertson Pamela E | $106,000 | -- |
Source: Public Records
Mortgage History
| Date | Status | Borrower | Loan Amount |
|---|---|---|---|
| Open | Cats Kari Louise | $131,577 | |
| Previous Owner | Page Paige | $98,100 |
Source: Public Records
Tax History Compared to Growth
Tax History
| Year | Tax Paid | Tax Assessment Tax Assessment Total Assessment is a certain percentage of the fair market value that is determined by local assessors to be the total taxable value of land and additions on the property. | Land | Improvement |
|---|---|---|---|---|
| 2024 | $4,344 | $451,000 | $93,800 | $357,200 |
| 2023 | $3,071 | $433,000 | $93,800 | $339,200 |
| 2022 | $3,458 | $339,000 | $86,000 | $253,000 |
| 2021 | $3,615 | $314,000 | $78,200 | $235,800 |
| 2020 | $3,754 | $304,000 | $78,200 | $225,800 |
| 2018 | $3,126 | $344,000 | $78,200 | $265,800 |
| 2017 | $2,447 | $277,000 | $78,200 | $198,800 |
| 2016 | $2,147 | $217,000 | $58,600 | $158,400 |
| 2015 | $2,135 | $193,000 | $56,700 | $136,300 |
| 2014 | -- | $186,000 | $56,700 | $129,300 |
| 2013 | -- | $126,000 | $56,700 | $69,300 |
Source: Public Records
Map
Nearby Homes
- 15809 Waynita Way NE Unit G-302
- 15615 Waynita Way NE Unit B-303
- 9127 NE 160th Place
- 9934 NE 162nd St
- 14713 98th Ave NE
- 8907 NE 152nd Place
- 9813 NE 145th St
- 15003 104th Ave NE
- 10554 NE 150th Ct
- 8401 NE 156th St
- 8403 NE 156th St
- 8407 NE 156th St
- 17209 W Riverside Dr
- 14335 Simonds Rd NE Unit A203
- 15028 108th Place NE
- 17338 Bothell Way NE Unit E
- 16831 84th Ln NE
- 17426 Bothell Way NE Unit A204
- 17426 Bothell Way NE Unit A407
- 16211 Simonds Rd NE
- 15711 Waynita Way NE Unit H102
- 15711 Waynita Way NE Unit H101
- 15711 Waynita Way NE Unit H-209
- 15711 Waynita Way NE Unit H105
- 15711 Waynita Way NE Unit H302
- 15711 Waynita Way NE Unit H107
- 15711 Waynita Way NE Unit H203
- 15711 Waynita Way NE Unit H303
- 15711 Waynita Way NE Unit H103
- 15711 Waynita Way NE Unit H205
- 15711 Waynita Way NE Unit H-202
- 15711 Waynita Way NE Unit H-206
- 15711 Waynita Way NE Unit H207
- 15711 Waynita Way NE Unit H301
- 15707 Waynita Way NE Unit C303
- 15707 Waynita Way NE Unit E106
- 15707 Waynita Way NE Unit A201
- 15707 Waynita Way NE Unit C204
- 15707 Waynita Way NE Unit G205
- 15707 Waynita Way NE Unit A208