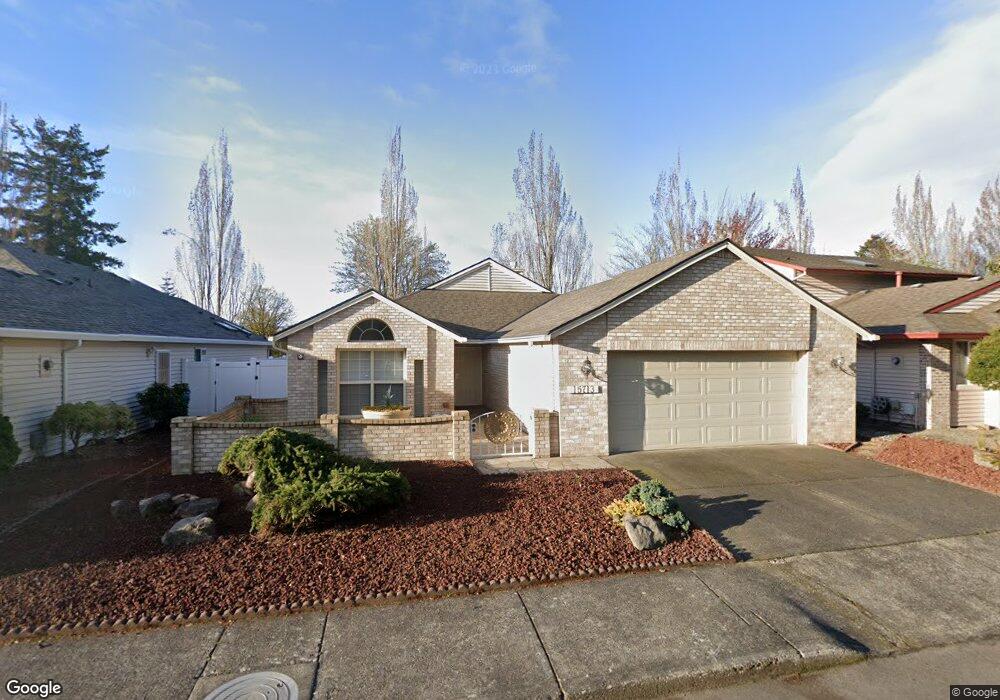
15713 SE 35th St Vancouver, WA 98683
Cascade Park NeighborhoodEstimated Value: $605,477 - $629,000
2
Beds
2
Baths
1,701
Sq Ft
$362/Sq Ft
Est. Value
About This Home
This home is located at 15713 SE 35th St, Vancouver, WA 98683 and is currently estimated at $616,369, approximately $362 per square foot. 15713 SE 35th St is a home located in Clark County with nearby schools including Riverview Elementary School, Shahala Middle School, and Mountain View High School.
Ownership History
Date
Name
Owned For
Owner Type
Purchase Details
Closed on
Nov 17, 2021
Sold by
Parker Jeanne and Parker Family Trust
Bought by
Everitt Jon S and Everitt Cynthia
Current Estimated Value
Purchase Details
Closed on
Aug 30, 2019
Sold by
Parker Gary P and Parker Jeanne A
Bought by
Parker Gary and Parker Jeanne
Purchase Details
Closed on
Jan 13, 2002
Sold by
Davies Willard D
Bought by
Parker Gary P and Parker Jeanne A
Home Financials for this Owner
Home Financials are based on the most recent Mortgage that was taken out on this home.
Original Mortgage
$176,000
Interest Rate
3.87%
Purchase Details
Closed on
Apr 2, 2001
Sold by
Davies W and Davies Barbara
Bought by
Davies Willard D and Willard D Davies Revocable Trust
Purchase Details
Closed on
Sep 15, 2000
Sold by
Robert Bertha Joyce
Bought by
Davies W and Davies Barbara
Home Financials for this Owner
Home Financials are based on the most recent Mortgage that was taken out on this home.
Original Mortgage
$100,000
Interest Rate
7.98%
Create a Home Valuation Report for This Property
The Home Valuation Report is an in-depth analysis detailing your home's value as well as a comparison with similar homes in the area
Home Values in the Area
Average Home Value in this Area
Purchase History
| Date | Buyer | Sale Price | Title Company |
|---|---|---|---|
| Everitt Jon S | $550,000 | Clark County Title Company | |
| Parker Gary | -- | None Available | |
| Parker Gary P | $220,000 | Cascade Title Of Clark Count | |
| Davies Willard D | -- | -- | |
| Davies W | $209,900 | Washington Title Company |
Source: Public Records
Mortgage History
| Date | Status | Borrower | Loan Amount |
|---|---|---|---|
| Previous Owner | Parker Gary P | $176,000 | |
| Previous Owner | Davies W | $100,000 |
Source: Public Records
Tax History Compared to Growth
Tax History
| Year | Tax Paid | Tax Assessment Tax Assessment Total Assessment is a certain percentage of the fair market value that is determined by local assessors to be the total taxable value of land and additions on the property. | Land | Improvement |
|---|---|---|---|---|
| 2025 | $5,166 | $541,191 | $203,950 | $337,241 |
| 2024 | $5,101 | $520,770 | $203,950 | $316,820 |
| 2023 | $4,825 | $533,592 | $203,500 | $330,092 |
| 2022 | $4,224 | $498,618 | $195,000 | $303,618 |
| 2021 | $3,983 | $413,910 | $159,300 | $254,610 |
| 2020 | $3,993 | $368,889 | $152,500 | $216,389 |
| 2019 | $3,791 | $373,331 | $152,500 | $220,831 |
| 2018 | $4,163 | $381,744 | $0 | $0 |
| 2017 | $3,793 | $336,955 | $0 | $0 |
| 2016 | $3,619 | $317,940 | $0 | $0 |
| 2015 | $3,531 | $290,440 | $0 | $0 |
| 2014 | -- | $270,877 | $0 | $0 |
| 2013 | -- | $229,982 | $0 | $0 |
Source: Public Records
Map
Nearby Homes
- 15701 SE 34th Cir
- 15815 SE 35th St
- 3911 SE 157th Ave
- 3112 SE 156th Ave Unit 7
- 15203 SE Northshore Dr
- 3205 SE 153rd Ave
- 3009 SE 155th Ave
- 0 SE Evergreen Hwy Unit 147631456
- 0 SE Evergreen Hwy Unit 211246418
- 4305 SE 159th Ct
- 15907 SE 29th St
- 3612 SE 165th Ave
- 16508 SE 39th St
- 2606 SE Baypoint Dr Unit 20
- 3708 SE 167th Ct
- 2512 SE Baypoint Dr Unit 37
- 2512 SE Baypoint Dr Unit 38
- 16215 SE Rivershore Dr
- 3515 SE 144th Ct
- 2403 SE Balboa Dr
- 15707 SE 35th St
- 15715 SE 35th St
- 15719 SE 35th St
- 15802 SE 35th St
- 15804 SE 35th St
- 15615 SE 35th St
- 15616 SE 35th St
- 15808 SE 35th St Unit 9
- 15611 SE 35th St
- 3408 SE 157th Ave
- 15811 SE 35th St
- 15810 SE 35th St
- 15608 SE 35th St
- 15705 SE 34th Cir
- 15703 SE 34th Cir Unit 7
- 15707 SE 34th Cir
- 3406 SE 157th Ave
- 15709 SE 34th Cir
- 15711 SE 34th Cir
- 15813 SE 35th St