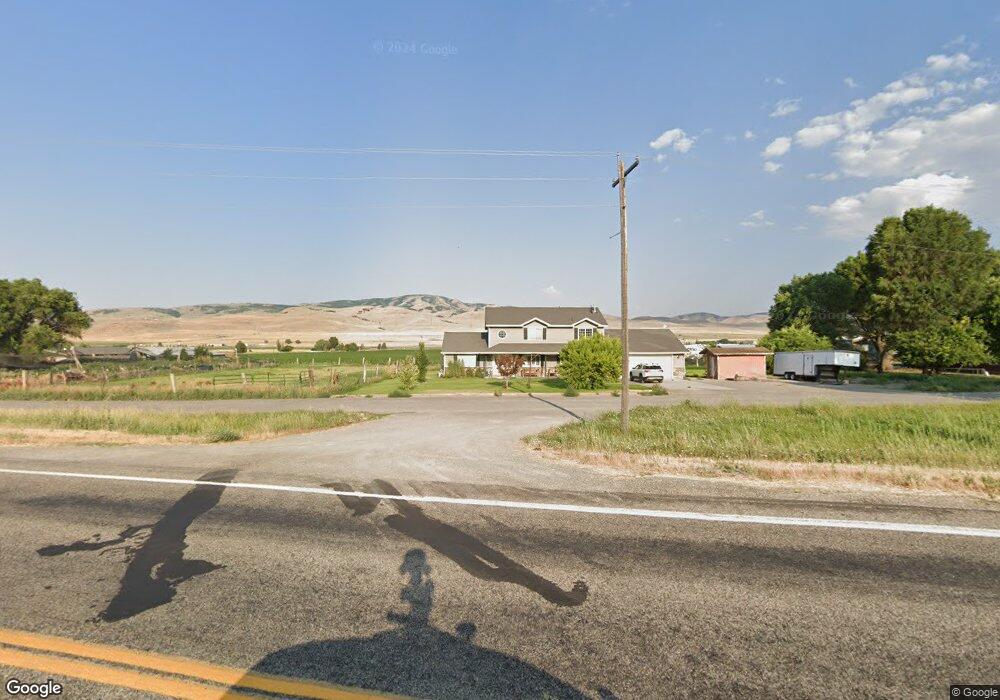
15715 N 5400 W Riverside, UT 84334
Estimated Value: $372,000 - $594,000
--
Bed
--
Bath
1,696
Sq Ft
$269/Sq Ft
Est. Value
About This Home
This home is located at 15715 N 5400 W, Riverside, UT 84334 and is currently estimated at $455,874, approximately $268 per square foot. 15715 N 5400 W is a home with nearby schools including Fielding School, Bear River Middle School, and Alice C. Harris Intermediate School.
Ownership History
Date
Name
Owned For
Owner Type
Purchase Details
Closed on
Dec 29, 2021
Sold by
Capener Lynn Alfred
Bought by
Rigby Jeffrey Osborne and Rigby Criston Jean
Current Estimated Value
Home Financials for this Owner
Home Financials are based on the most recent Mortgage that was taken out on this home.
Original Mortgage
$60,000
Outstanding Balance
$57,052
Interest Rate
3.11%
Mortgage Type
USDA
Estimated Equity
$398,822
Purchase Details
Closed on
Dec 17, 2021
Sold by
Capener Brothers Dairy Farm
Bought by
Capener Lynn Alfred
Home Financials for this Owner
Home Financials are based on the most recent Mortgage that was taken out on this home.
Original Mortgage
$60,000
Outstanding Balance
$57,052
Interest Rate
3.11%
Mortgage Type
USDA
Estimated Equity
$398,822
Purchase Details
Closed on
Dec 11, 2021
Sold by
Capener Brothers Dairy Farm
Bought by
Capener Lynn Alfred
Home Financials for this Owner
Home Financials are based on the most recent Mortgage that was taken out on this home.
Original Mortgage
$60,000
Outstanding Balance
$57,052
Interest Rate
3.11%
Mortgage Type
USDA
Estimated Equity
$398,822
Create a Home Valuation Report for This Property
The Home Valuation Report is an in-depth analysis detailing your home's value as well as a comparison with similar homes in the area
Home Values in the Area
Average Home Value in this Area
Purchase History
| Date | Buyer | Sale Price | Title Company |
|---|---|---|---|
| Rigby Jeffrey Osborne | -- | American Secure Ttl Tremonto | |
| Rigby Jeffrey Osborne | -- | None Listed On Document | |
| Capener Lynn Alfred | -- | American Secure Ttl Tremonto | |
| Capener Lynn Alfred | -- | None Listed On Document |
Source: Public Records
Mortgage History
| Date | Status | Borrower | Loan Amount |
|---|---|---|---|
| Open | Rigby Jeffrey Osborne | $60,000 | |
| Open | Rigby Jeffrey Osborne | $600,000 |
Source: Public Records
Tax History Compared to Growth
Tax History
| Year | Tax Paid | Tax Assessment Tax Assessment Total Assessment is a certain percentage of the fair market value that is determined by local assessors to be the total taxable value of land and additions on the property. | Land | Improvement |
|---|---|---|---|---|
| 2025 | $1,899 | $353,079 | $130,000 | $223,079 |
| 2024 | $1,687 | $353,444 | $130,000 | $223,444 |
| 2023 | $1,735 | $368,736 | $130,000 | $238,736 |
| 2022 | $1,546 | $308,736 | $65,000 | $243,736 |
| 2021 | $880 | $154,741 | $30,000 | $124,741 |
| 2020 | $911 | $154,741 | $30,000 | $124,741 |
| 2019 | $827 | $73,673 | $16,500 | $57,173 |
| 2018 | $794 | $66,216 | $16,500 | $49,716 |
| 2017 | $820 | $120,392 | $16,500 | $90,392 |
| 2016 | $786 | $63,848 | $16,500 | $47,348 |
| 2015 | $723 | $59,544 | $16,500 | $43,044 |
| 2014 | $723 | $57,494 | $16,500 | $40,994 |
| 2013 | -- | $53,767 | $16,500 | $37,267 |
Source: Public Records
Map
Nearby Homes
- 15270 N 5475 W
- 16115 N 6000 W
- Berrington Plan at Lookout Mountain
- Stanton Plan at Lookout Mountain
- Cambria Plan at Lookout Mountain
- Brantwood Plan at Lookout Mountain
- Hallwood Plan at Lookout Mountain
- Vanbrough Plan at Lookout Mountain
- Norfolk Plan at Lookout Mountain
- Xavier Plan at Lookout Mountain
- Foxhill Plan at Lookout Mountain
- Knighton Plan at Lookout Mountain
- Winfield Plan at Lookout Mountain
- Edgeworth Plan at Lookout Mountain
- Somerley Plan at Lookout Mountain
- Aldin Plan at Lookout Mountain
- Northfield Plan at Lookout Mountain
- Oakfield Plan at Lookout Mountain
- Denford Plan at Lookout Mountain
- 16580 N 5200 W
- 15580 N 5400 W
- 15520 N 5400 W
- 15615 N 5400 W
- 15575 N 5325 W
- 15490 N 5400 W
- 5445 W 15500 N
- 15530 N 5475 W
- 15285 N 4950 W Unit 27
- 15290 N 4950 W Unit 22
- 15270 N 4950 W Unit 23
- 15254 N 4950 W Unit 24
- 15251 N 4950 W Unit 25
- 15251 N 4950 W
- 15580 N 5325 W
- 15485 N 5325 W
- 5320 W 15500 N
- 15685 N 5400 W
- 15465 N 5400 W
- 15480 N 5475 W
- 5310 W 15500 N