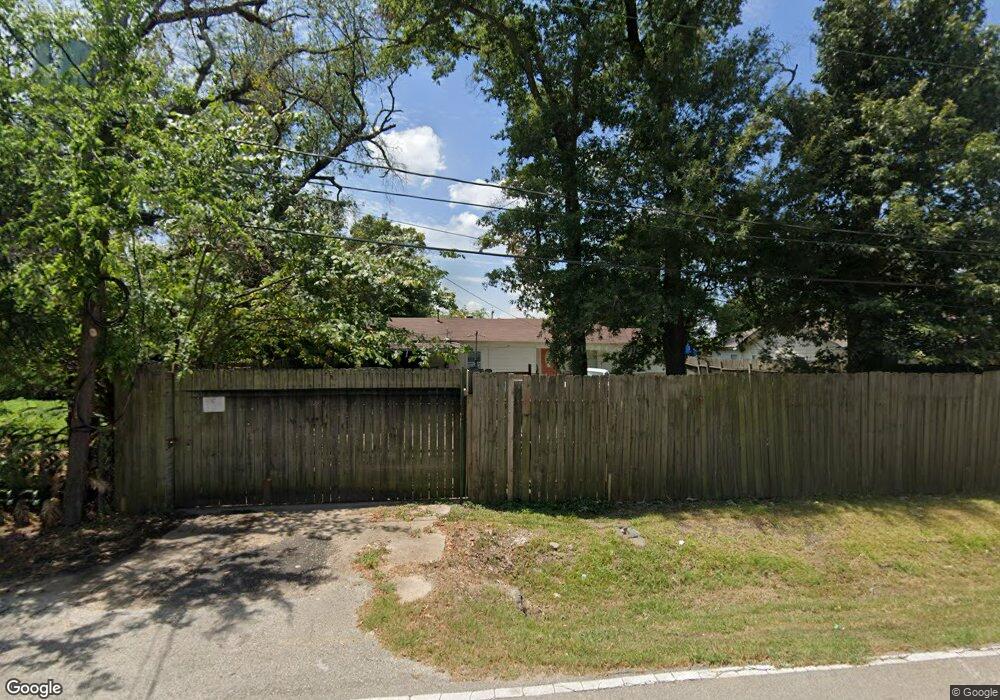
15718 Garlang St Channelview, TX 77530
Estimated Value: $136,000 - $203,000
3
Beds
2
Baths
1,130
Sq Ft
$148/Sq Ft
Est. Value
About This Home
This home is located at 15718 Garlang St, Channelview, TX 77530 and is currently estimated at $166,752, approximately $147 per square foot. 15718 Garlang St is a home located in Harris County with nearby schools including Channelview High School and Family Christian Academy.
Ownership History
Date
Name
Owned For
Owner Type
Purchase Details
Closed on
May 25, 2018
Sold by
Nhan Peter
Bought by
Vela Jose L Davila and Garza Esther Palomino
Current Estimated Value
Home Financials for this Owner
Home Financials are based on the most recent Mortgage that was taken out on this home.
Original Mortgage
$95,000
Interest Rate
4.5%
Mortgage Type
Seller Take Back
Purchase Details
Closed on
Feb 21, 2017
Sold by
Lane Richard Alexander
Bought by
Vanvanle Hai Van and Ton Mai Thi Tuyet
Purchase Details
Closed on
Feb 9, 2016
Sold by
Gross Phillip Wayne and Gross Richmond Glenda Faye
Bought by
Lange Richard Alexander
Create a Home Valuation Report for This Property
The Home Valuation Report is an in-depth analysis detailing your home's value as well as a comparison with similar homes in the area
Home Values in the Area
Average Home Value in this Area
Purchase History
| Date | Buyer | Sale Price | Title Company |
|---|---|---|---|
| Vela Jose L Davila | -- | None Available | |
| Vanvanle Hai Van | -- | None Available | |
| Lange Richard Alexander | -- | None Available |
Source: Public Records
Mortgage History
| Date | Status | Borrower | Loan Amount |
|---|---|---|---|
| Previous Owner | Vela Jose L Davila | $95,000 |
Source: Public Records
Tax History Compared to Growth
Tax History
| Year | Tax Paid | Tax Assessment Tax Assessment Total Assessment is a certain percentage of the fair market value that is determined by local assessors to be the total taxable value of land and additions on the property. | Land | Improvement |
|---|---|---|---|---|
| 2025 | $913 | $98,719 | $55,865 | $42,854 |
| 2024 | $913 | $81,000 | $23,522 | $57,478 |
| 2023 | $913 | $82,674 | $23,522 | $59,152 |
| 2022 | $1,924 | $82,674 | $23,522 | $59,152 |
| 2021 | $1,331 | $54,933 | $17,642 | $37,291 |
| 2020 | $827 | $32,207 | $5,292 | $26,915 |
| 2019 | $846 | $32,207 | $5,292 | $26,915 |
| 2018 | $450 | $32,207 | $5,292 | $26,915 |
| 2017 | $847 | $32,207 | $5,292 | $26,915 |
| 2016 | $847 | $32,207 | $5,292 | $26,915 |
| 2015 | $865 | $32,207 | $5,292 | $26,915 |
| 2014 | $865 | $32,207 | $5,292 | $26,915 |
Source: Public Records
Map
Nearby Homes
- 523 Sheldon Rd
- 431 Crockett St
- 15603 N Brentwood St
- 702 Norell St
- 15506 Vonnett St
- 714 Horncastle St
- 812 Coolidge St
- 818 Mccardell St
- 822 Woodhue St
- 16305 De Zavalla Rd
- 815 Spates St
- 814 Kilpatrick St
- 743 Knob Hollow St
- 803 Knob Hollow St
- 16032 1/2 Ridlon St
- 16023 Ridlon St
- 722 Canna St
- 16516 Market St
- 908 Lakeside Dr
- 714 Ivy Hollow St
- 15716 Garlang St
- 15720 Garlang St
- 15714 Garlang St
- 15724 Garlang St
- 15712 Garlang St
- 15719 Garlang St
- 15721 Garlang St
- 15715 Garlang St
- 15710 Garlang St
- 15723 Garlang St
- 15726 Garlang St
- 15713 Garlang St
- 15727 Garlang St
- 15708 Garlang St
- 15711 Garlang St
- 15709 Garlang St
- 15706 Garlang St
- 309 Sheldon Rd
- 15735 Market St Unit 3
- 15735 Market St Unit 1