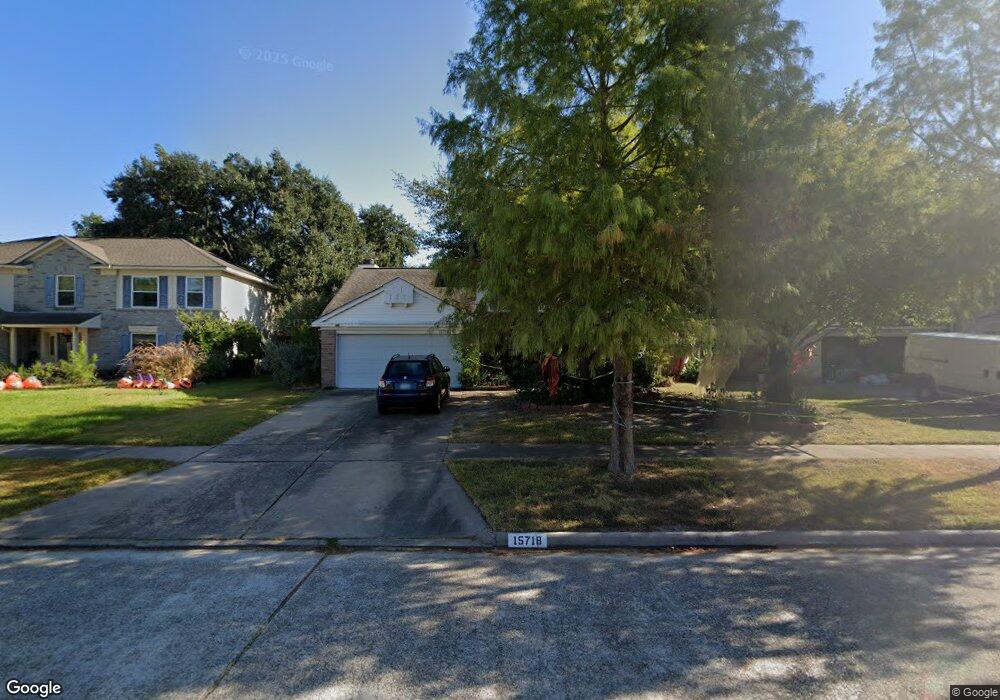
15718 Pinyon Creek Dr Houston, TX 77095
Copperfield NeighborhoodEstimated Value: $260,000 - $271,000
3
Beds
3
Baths
1,862
Sq Ft
$142/Sq Ft
Est. Value
About This Home
This home is located at 15718 Pinyon Creek Dr, Houston, TX 77095 and is currently estimated at $263,663, approximately $141 per square foot. 15718 Pinyon Creek Dr is a home located in Harris County with nearby schools including Fiest Elementary School, Labay Middle School, and Cypress Falls High School.
Ownership History
Date
Name
Owned For
Owner Type
Purchase Details
Closed on
Oct 26, 2001
Sold by
Baker Jerald Wayne and Baker Deborah Jean
Bought by
Macomber Michael David and Macomber Bernadette
Current Estimated Value
Home Financials for this Owner
Home Financials are based on the most recent Mortgage that was taken out on this home.
Original Mortgage
$109,777
Outstanding Balance
$43,064
Interest Rate
6.77%
Mortgage Type
FHA
Estimated Equity
$220,599
Purchase Details
Closed on
Nov 23, 1993
Sold by
Maltagliati Gerald V and Maltagliati Sharon L
Bought by
Baker Jerald Wayne and Baker Deborah Jean
Home Financials for this Owner
Home Financials are based on the most recent Mortgage that was taken out on this home.
Original Mortgage
$83,996
Interest Rate
6.71%
Mortgage Type
FHA
Create a Home Valuation Report for This Property
The Home Valuation Report is an in-depth analysis detailing your home's value as well as a comparison with similar homes in the area
Home Values in the Area
Average Home Value in this Area
Purchase History
| Date | Buyer | Sale Price | Title Company |
|---|---|---|---|
| Macomber Michael David | -- | American Title Co | |
| Baker Jerald Wayne | -- | -- |
Source: Public Records
Mortgage History
| Date | Status | Borrower | Loan Amount |
|---|---|---|---|
| Open | Macomber Michael David | $109,777 | |
| Previous Owner | Baker Jerald Wayne | $83,996 |
Source: Public Records
Tax History Compared to Growth
Tax History
| Year | Tax Paid | Tax Assessment Tax Assessment Total Assessment is a certain percentage of the fair market value that is determined by local assessors to be the total taxable value of land and additions on the property. | Land | Improvement |
|---|---|---|---|---|
| 2025 | $2,844 | $228,044 | $72,590 | $155,454 |
| 2024 | $2,844 | $232,837 | $64,875 | $167,962 |
| 2023 | $2,844 | $229,909 | $64,875 | $165,034 |
| 2022 | $4,266 | $208,891 | $49,796 | $159,095 |
| 2021 | $4,180 | $185,560 | $49,796 | $135,764 |
| 2020 | $3,903 | $163,675 | $41,380 | $122,295 |
| 2019 | $3,722 | $150,800 | $32,613 | $118,187 |
| 2018 | $1,287 | $142,996 | $32,613 | $110,383 |
| 2017 | $3,194 | $149,000 | $32,613 | $116,387 |
| 2016 | $2,903 | $149,000 | $32,613 | $116,387 |
| 2015 | $1,155 | $149,422 | $32,613 | $116,809 |
| 2014 | $1,155 | $127,865 | $27,353 | $100,512 |
Source: Public Records
Map
Nearby Homes
- 8203 Green Devon Dr
- 15918 Pinyon Creek Dr
- 8211 Riverglade Dr
- 15854 Knolls Lodge Dr
- 15339 Glenwood Park Dr
- 8526 Hot Springs Dr
- 15611 Meadow Village Dr
- 8306 Lake Crystal Dr
- 16026 Autumn Falls Ln
- 15954 Oak Mountain Dr
- 8526 Greenleaf Lake Dr
- 7731 Club Lake Dr
- 15131 New Hastings Dr
- 16030 Royal Garden Dr
- 16114 Kintyre Point Rd
- 8550 Sparkling Springs Dr
- 15415 Swan Creek Dr
- 15414 Swan Creek Dr
- 8426 Laurel Trails Dr
- 15010 Chetland Place Dr
- 15722 Pinyon Creek Dr
- 15714 Pinyon Creek Dr
- 8007 Silver Fir Dr
- 8011 Silver Fir Dr
- 15802 Pinyon Creek Dr
- 15710 Pinyon Creek Dr
- 8003 Silver Fir Dr
- 8015 Silver Fir Dr
- 15719 Pinyon Creek Dr
- 15715 Pinyon Creek Dr
- 15723 Pinyon Creek Dr
- 15706 Pinyon Creek Dr
- 15806 Pinyon Creek Dr
- 8019 Silver Fir Dr
- 8002 Green Devon Dr
- 15711 Pinyon Creek Dr
- 15803 Pinyon Creek Dr
- 8103 Silver Fir Dr
- 8019 Pine Falls Dr
- 15707 Pinyon Creek Dr