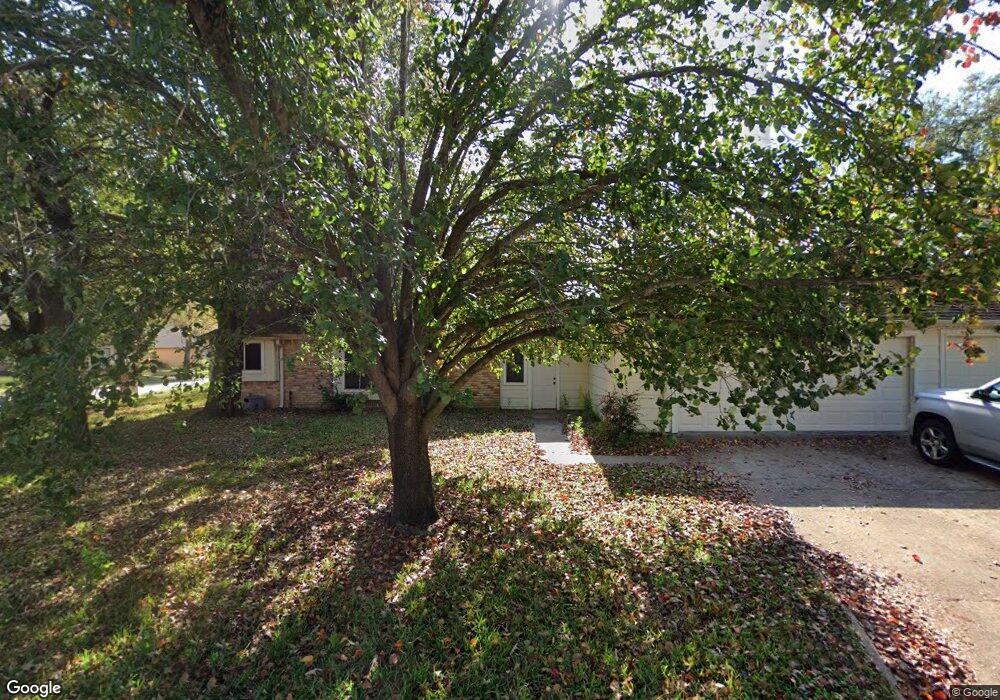
15719 Oxenford Dr Tomball, TX 77377
Estimated Value: $319,000 - $367,383
4
Beds
3
Baths
1,599
Sq Ft
$221/Sq Ft
Est. Value
About This Home
This home is located at 15719 Oxenford Dr, Tomball, TX 77377 and is currently estimated at $352,596, approximately $220 per square foot. 15719 Oxenford Dr is a home located in Harris County with nearby schools including Lakewood Elementary School, Willow Wood Junior High School, and Northpointe Intermediate School.
Ownership History
Date
Name
Owned For
Owner Type
Purchase Details
Closed on
Aug 16, 2013
Sold by
Wirth Martin E
Bought by
Hawkins Wyatt and Hawkins Ashley
Current Estimated Value
Home Financials for this Owner
Home Financials are based on the most recent Mortgage that was taken out on this home.
Original Mortgage
$175,757
Outstanding Balance
$131,895
Interest Rate
4.62%
Mortgage Type
FHA
Estimated Equity
$220,701
Purchase Details
Closed on
Mar 31, 2012
Sold by
Salinas Norma and Wirth Norma Salinas
Bought by
Wirth Martin E and Wirth Martin Edward
Purchase Details
Closed on
Oct 18, 1995
Sold by
Roth John J and Roth Carol J
Bought by
Wirth Martin E
Home Financials for this Owner
Home Financials are based on the most recent Mortgage that was taken out on this home.
Original Mortgage
$91,800
Interest Rate
7.62%
Create a Home Valuation Report for This Property
The Home Valuation Report is an in-depth analysis detailing your home's value as well as a comparison with similar homes in the area
Home Values in the Area
Average Home Value in this Area
Purchase History
| Date | Buyer | Sale Price | Title Company |
|---|---|---|---|
| Hawkins Wyatt | -- | Great American Title Company | |
| Wirth Martin E | -- | None Available | |
| Wirth Martin E | -- | Stewart Title |
Source: Public Records
Mortgage History
| Date | Status | Borrower | Loan Amount |
|---|---|---|---|
| Open | Hawkins Wyatt | $175,757 | |
| Previous Owner | Wirth Martin E | $91,800 |
Source: Public Records
Tax History Compared to Growth
Tax History
| Year | Tax Paid | Tax Assessment Tax Assessment Total Assessment is a certain percentage of the fair market value that is determined by local assessors to be the total taxable value of land and additions on the property. | Land | Improvement |
|---|---|---|---|---|
| 2025 | $5,405 | $371,089 | $52,285 | $318,804 |
| 2024 | $5,405 | $384,892 | $52,285 | $332,607 |
| 2023 | $5,405 | $384,892 | $52,285 | $332,607 |
| 2022 | $6,231 | $355,976 | $44,241 | $311,735 |
| 2021 | $5,976 | $288,274 | $40,219 | $248,055 |
| 2020 | $5,639 | $230,758 | $28,958 | $201,800 |
| 2019 | $5,265 | $230,758 | $28,958 | $201,800 |
| 2018 | $2,077 | $180,000 | $28,958 | $151,042 |
| 2017 | $4,778 | $180,000 | $28,958 | $151,042 |
| 2016 | $5,409 | $209,090 | $28,958 | $180,132 |
| 2015 | $4,873 | $185,222 | $28,958 | $156,264 |
| 2014 | $4,873 | $179,514 | $28,958 | $150,556 |
Source: Public Records
Map
Nearby Homes
- 11606 Gatesden Dr
- 11510 Maple Falls Dr
- 15603 Canterbury Forest Dr
- 15703 Downford Dr
- 15627 Lago Villa Dr
- 15834 Arbor Lake Dr
- 11607 Buck Springs Trail
- 11619 Buck Springs Trail
- 15603 Lakewood Terrace Dr
- 15522 Waldwick Dr
- 15614 Hatfield Hollow Dr
- 15418 Waldwick Dr
- 11719 Lakewood Crossing Dr
- 11722 Gray Forest Trail
- 11802 Laurel Meadow Dr
- 16102 Buckhead Ct
- 11831 Gray Forest Trail
- 15915 Broad Oak Ct
- 15902 Timber Grove Ct
- 16206 Lakewood Field Dr
- 15715 Oxenford Dr
- 15718 Gilbertyn Dr
- 15718 Gilbertyn Dr
- 15714 Gilbertyn Dr
- 15718 Oxenford Dr
- 11602 Gatesden Dr
- 15711 Oxenford Dr
- 15714 Oxenford Dr
- 15710 Gilbertyn Dr
- 11610 Gatesden Dr
- 11510 Gatesden Dr
- 15710 Oxenford Dr
- 15707 Oxenford Dr
- 15719 Gilbertyn Dr
- 15719 Baldswelle Dr
- 15706 Gilbertyn Dr
- 15715 Gilbertyn Dr
- 11614 Gatesden Dr
- 11506 Gatesden Dr
- 15715 Baldswelle Dr