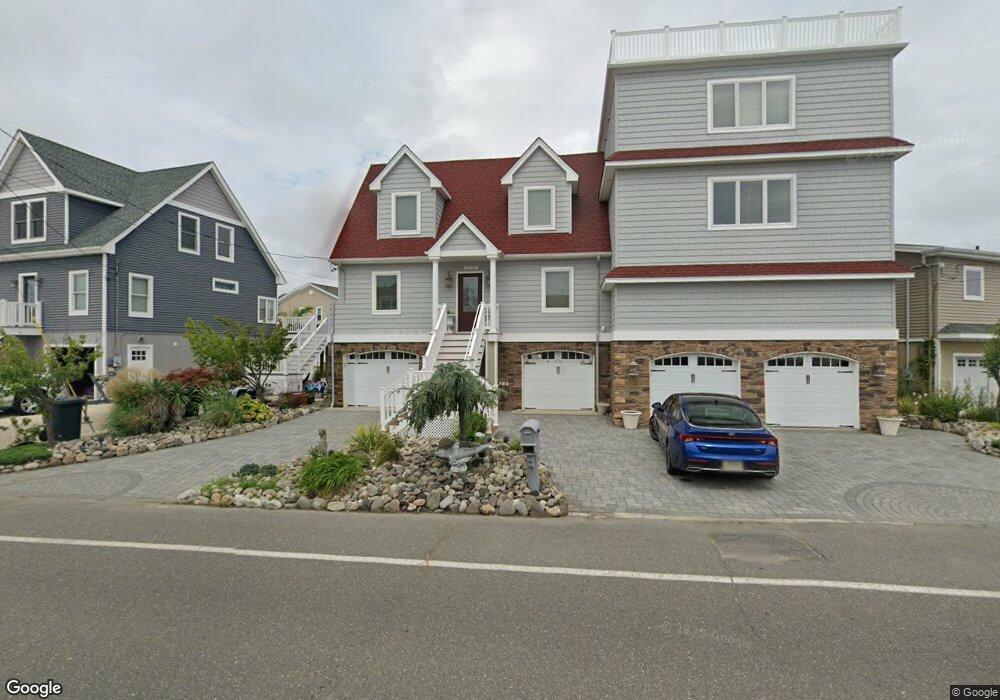
1572 Mill Creek Rd Manahawkin, NJ 08050
Stafford NeighborhoodEstimated Value: $912,000 - $1,246,000
4
Beds
4
Baths
2,344
Sq Ft
$455/Sq Ft
Est. Value
About This Home
This home is located at 1572 Mill Creek Rd, Manahawkin, NJ 08050 and is currently estimated at $1,067,348, approximately $455 per square foot. 1572 Mill Creek Rd is a home located in Ocean County with nearby schools including Oxycocus Elementary School, Ocean Acres Elementary School, and McKinley Avenue Elementary School.
Ownership History
Date
Name
Owned For
Owner Type
Purchase Details
Closed on
May 12, 2000
Sold by
Bright Ernest
Bought by
Esposito Frank
Current Estimated Value
Home Financials for this Owner
Home Financials are based on the most recent Mortgage that was taken out on this home.
Original Mortgage
$116,100
Outstanding Balance
$39,993
Interest Rate
8.1%
Mortgage Type
Purchase Money Mortgage
Estimated Equity
$1,027,355
Purchase Details
Closed on
Jan 26, 1999
Sold by
Prescott Robert E
Bought by
Bright Ernest and Bright Donna
Create a Home Valuation Report for This Property
The Home Valuation Report is an in-depth analysis detailing your home's value as well as a comparison with similar homes in the area
Home Values in the Area
Average Home Value in this Area
Purchase History
| Date | Buyer | Sale Price | Title Company |
|---|---|---|---|
| Esposito Frank | $129,000 | -- | |
| Bright Ernest | $60,000 | Old Republic Natl Title Ins |
Source: Public Records
Mortgage History
| Date | Status | Borrower | Loan Amount |
|---|---|---|---|
| Open | Esposito Frank | $116,100 |
Source: Public Records
Tax History Compared to Growth
Tax History
| Year | Tax Paid | Tax Assessment Tax Assessment Total Assessment is a certain percentage of the fair market value that is determined by local assessors to be the total taxable value of land and additions on the property. | Land | Improvement |
|---|---|---|---|---|
| 2025 | $10,707 | $431,200 | $184,600 | $246,600 |
| 2024 | $10,603 | $431,200 | $184,600 | $246,600 |
| 2023 | $10,150 | $431,200 | $184,600 | $246,600 |
| 2022 | $9,993 | $424,500 | $184,600 | $239,900 |
| 2021 | $9,857 | $424,500 | $184,600 | $239,900 |
| 2020 | $9,870 | $424,500 | $184,600 | $239,900 |
| 2019 | $9,730 | $424,500 | $184,600 | $239,900 |
| 2018 | $9,670 | $424,500 | $184,600 | $239,900 |
| 2017 | $8,986 | $381,900 | $149,800 | $232,100 |
| 2016 | $8,894 | $381,900 | $149,800 | $232,100 |
| 2015 | $8,581 | $282,900 | $149,800 | $133,100 |
| 2014 | $7,444 | $327,200 | $147,200 | $180,000 |
Source: Public Records
Map
Nearby Homes