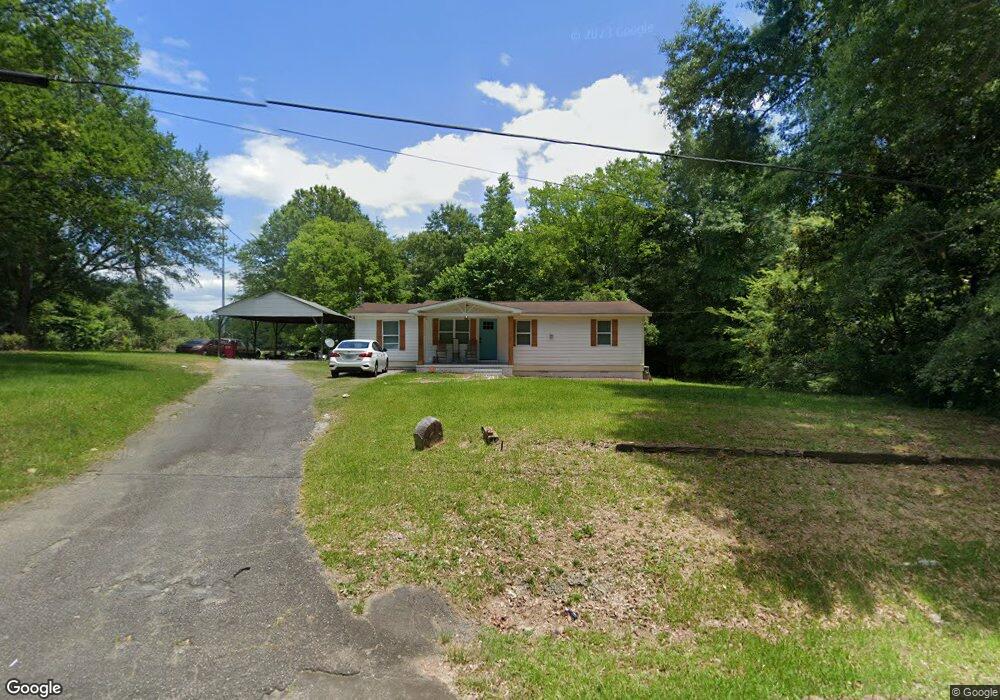
1572 Tucker Rd Macon, GA 31220
Estimated Value: $133,641 - $181,000
3
Beds
2
Baths
1,126
Sq Ft
$139/Sq Ft
Est. Value
About This Home
This home is located at 1572 Tucker Rd, Macon, GA 31220 and is currently estimated at $156,160, approximately $138 per square foot. 1572 Tucker Rd is a home located in Bibb County with nearby schools including Heritage Elementary School, Weaver Middle School, and Westside High School.
Ownership History
Date
Name
Owned For
Owner Type
Purchase Details
Closed on
Dec 16, 2019
Sold by
Landsafe Home Builders Llc
Bought by
Lundy Vaquishala
Current Estimated Value
Home Financials for this Owner
Home Financials are based on the most recent Mortgage that was taken out on this home.
Original Mortgage
$120,828
Outstanding Balance
$106,527
Interest Rate
3.6%
Mortgage Type
FHA
Estimated Equity
$49,633
Purchase Details
Closed on
Nov 14, 2019
Sold by
Roy Property Llc
Bought by
Landsafe Home Builders Llc
Home Financials for this Owner
Home Financials are based on the most recent Mortgage that was taken out on this home.
Original Mortgage
$120,828
Outstanding Balance
$106,527
Interest Rate
3.6%
Mortgage Type
FHA
Estimated Equity
$49,633
Purchase Details
Closed on
Nov 9, 2018
Sold by
Bryant Gary W
Bought by
Roy Property Llc
Purchase Details
Closed on
Nov 17, 2017
Sold by
Patrick Legacy Llc
Bought by
Roy Property Llc
Purchase Details
Closed on
Apr 3, 2002
Sold by
Mcallister Ann Jeanette
Bought by
Mcallister Ann J Life Est -
Create a Home Valuation Report for This Property
The Home Valuation Report is an in-depth analysis detailing your home's value as well as a comparison with similar homes in the area
Home Values in the Area
Average Home Value in this Area
Purchase History
| Date | Buyer | Sale Price | Title Company |
|---|---|---|---|
| Lundy Vaquishala | $125,000 | None Available | |
| Landsafe Home Builders Llc | -- | None Available | |
| Roy Property Llc | -- | None Available | |
| Roy Property Llc | $31,000 | None Available | |
| Mcallister Ann J Life Est - | -- | -- |
Source: Public Records
Mortgage History
| Date | Status | Borrower | Loan Amount |
|---|---|---|---|
| Open | Lundy Vaquishala | $120,828 |
Source: Public Records
Tax History Compared to Growth
Tax History
| Year | Tax Paid | Tax Assessment Tax Assessment Total Assessment is a certain percentage of the fair market value that is determined by local assessors to be the total taxable value of land and additions on the property. | Land | Improvement |
|---|---|---|---|---|
| 2024 | $843 | $33,192 | $8,446 | $24,746 |
| 2023 | $738 | $29,055 | $7,541 | $21,514 |
| 2022 | $919 | $26,531 | $11,122 | $15,409 |
| 2021 | $1,008 | $26,531 | $11,122 | $15,409 |
| 2020 | $1,030 | $26,531 | $11,122 | $15,409 |
| 2019 | $972 | $24,836 | $11,122 | $13,714 |
| 2018 | $1,669 | $24,836 | $11,122 | $13,714 |
| 2017 | $930 | $24,836 | $11,122 | $13,714 |
| 2016 | $859 | $24,836 | $11,122 | $13,714 |
| 2015 | $874 | $24,836 | $11,122 | $13,714 |
| 2014 | $323 | $26,731 | $13,017 | $13,714 |
Source: Public Records
Map
Nearby Homes
- 1564 Tucker Rd
- 1580 Tucker Rd
- 1563 Tucker Rd
- 1573 Tucker Rd
- 1620 Tucker Rd
- 1535 Ginny Dr
- 1545 Tucker Rd
- 1557 Ginny Dr
- 5816 Price Rd
- 1611 Tucker Rd
- 1573 Ginny Dr
- 1573 Ginny Dr Unit 21
- 5800 Price Rd
- 1554 Ginny Dr
- 1589 Ginny Dr
- 1648 Tucker Rd
- 1570 Ginny Dr
- 1644 Arrington Ct
- 1661 Arrington Ct
- 5490 Stratford Hills Dr