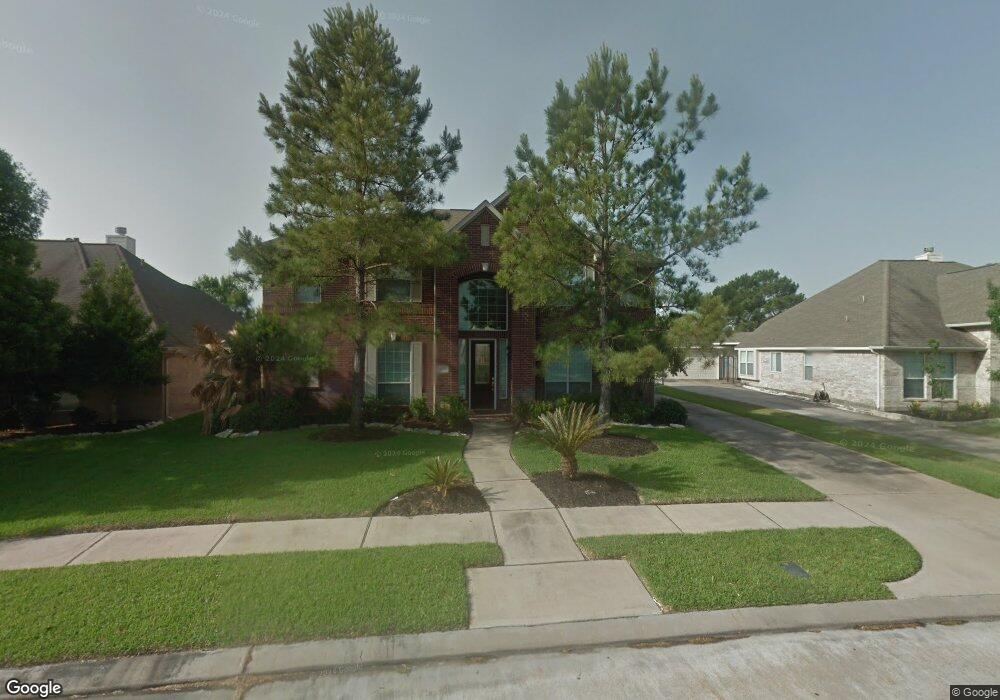
15723 Sweetrose Place Houston, TX 77095
Estimated Value: $407,000 - $423,184
5
Beds
4
Baths
3,039
Sq Ft
$137/Sq Ft
Est. Value
About This Home
This home is located at 15723 Sweetrose Place, Houston, TX 77095 and is currently estimated at $417,296, approximately $137 per square foot. 15723 Sweetrose Place is a home located in Harris County with nearby schools including Fiest Elementary School, Labay Middle School, and Cypress Falls High School.
Ownership History
Date
Name
Owned For
Owner Type
Purchase Details
Closed on
Sep 14, 2016
Sold by
Raghu Damodarn and Raghu Bindu
Bought by
Mckinnon Christopher J and Mckinnon Helen L
Current Estimated Value
Home Financials for this Owner
Home Financials are based on the most recent Mortgage that was taken out on this home.
Original Mortgage
$240,562
Outstanding Balance
$192,152
Interest Rate
3.43%
Mortgage Type
FHA
Estimated Equity
$225,144
Purchase Details
Closed on
Nov 16, 2001
Sold by
Morrison Homes Of Texas Inc
Bought by
Raghu Damodaran and Raghu Bindu
Home Financials for this Owner
Home Financials are based on the most recent Mortgage that was taken out on this home.
Original Mortgage
$163,848
Interest Rate
6.59%
Create a Home Valuation Report for This Property
The Home Valuation Report is an in-depth analysis detailing your home's value as well as a comparison with similar homes in the area
Home Values in the Area
Average Home Value in this Area
Purchase History
| Date | Buyer | Sale Price | Title Company |
|---|---|---|---|
| Mckinnon Christopher J | -- | Stewart Title | |
| Raghu Damodaran | -- | Commerce Land Title |
Source: Public Records
Mortgage History
| Date | Status | Borrower | Loan Amount |
|---|---|---|---|
| Open | Mckinnon Christopher J | $240,562 | |
| Previous Owner | Raghu Damodaran | $163,848 |
Source: Public Records
Tax History Compared to Growth
Tax History
| Year | Tax Paid | Tax Assessment Tax Assessment Total Assessment is a certain percentage of the fair market value that is determined by local assessors to be the total taxable value of land and additions on the property. | Land | Improvement |
|---|---|---|---|---|
| 2025 | $6,115 | $383,816 | $71,511 | $312,305 |
| 2024 | $6,115 | $383,816 | $71,511 | $312,305 |
| 2023 | $6,115 | $388,009 | $71,511 | $316,498 |
| 2022 | $7,977 | $351,338 | $52,875 | $298,463 |
| 2021 | $7,675 | $296,237 | $52,875 | $243,362 |
| 2020 | $7,581 | $282,451 | $43,773 | $238,678 |
| 2019 | $7,099 | $262,538 | $33,805 | $228,733 |
| 2018 | $2,314 | $232,101 | $33,805 | $198,296 |
| 2017 | $6,490 | $232,101 | $33,805 | $198,296 |
| 2016 | $6,490 | $232,101 | $33,805 | $198,296 |
| 2015 | $5,059 | $233,200 | $33,805 | $199,395 |
| 2014 | $5,059 | $215,000 | $32,072 | $182,928 |
Source: Public Records
Map
Nearby Homes
- 15802 Aberdeen Trails Dr
- 15735 Jamie Lee Dr
- 9303 Reston Grove Ln
- 9111 Sunny Ridge Dr
- 15627 Kentwater Ct
- 15610 Manorford Ct
- 9138 Shango Ln
- 8818 Apple Mill Dr
- 15906 Marwick Ct
- 15610 Tarpon Springs Ct
- 8526 Greenleaf Lake Dr
- 15634 Haleys Landing Ln
- 8814 Sherina Park Dr
- 16111 Aberdeen Forest Dr
- 16123 Aberdeen Forest Dr
- 15954 Oak Mountain Dr
- 15407 Copper Branch Ln
- 8550 Sparkling Springs Dr
- 9119 Baber Dr
- 9111 Baber Dr
- 15803 Sweetrose Place
- 15719 Sweetrose Place
- 15734 Aberdeen Trails Dr
- 15715 Sweetrose Place
- 15807 Sweetrose Place
- 15810 Aberdeen Trails Dr
- 15730 Aberdeen Trails Dr
- 15722 Sweetrose Place
- 15718 Sweetrose Place
- 15814 Aberdeen Trails Dr
- 15806 Sweetrose Place
- 15811 Sweetrose Place
- 15726 Aberdeen Trails Dr
- 15711 Sweetrose Place
- 15710 Sweetrose Place
- 15818 Aberdeen Trails Dr
- 15810 Sweetrose Place
- 15722 Aberdeen Trails Dr
- 15723 Swandale Ln
- 15815 Sweetrose Place