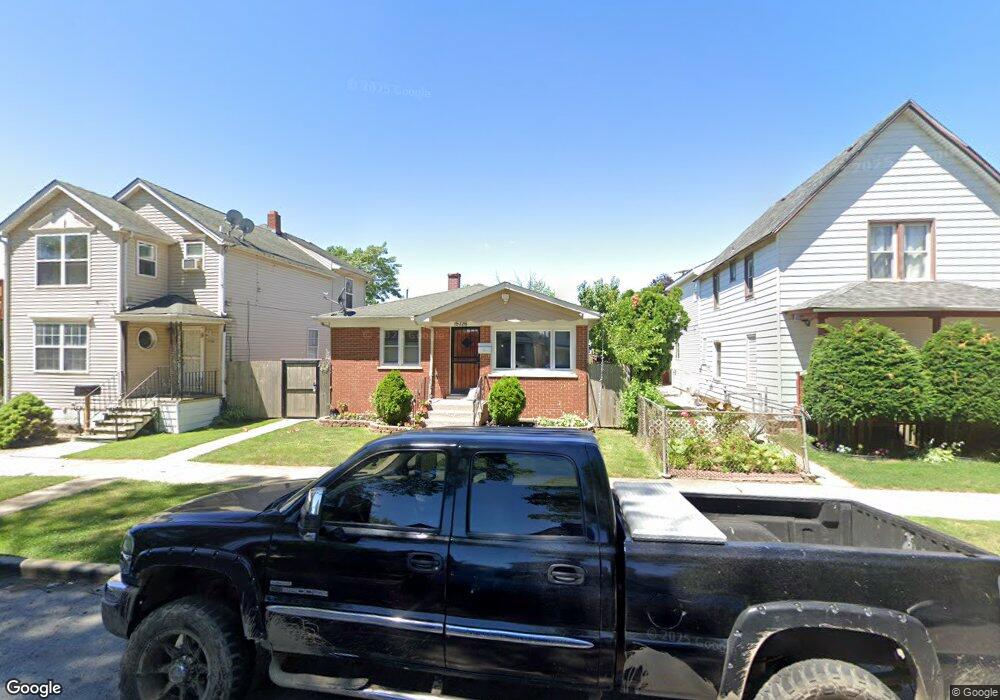
15726 Woodbridge Ave Harvey, IL 60426
Estimated Value: $105,000 - $134,000
3
Beds
2
Baths
1,013
Sq Ft
$123/Sq Ft
Est. Value
About This Home
This home is located at 15726 Woodbridge Ave, Harvey, IL 60426 and is currently estimated at $124,958, approximately $123 per square foot. 15726 Woodbridge Ave is a home located in Cook County with nearby schools including Holmes Elementary School, Brooks Middle School, and Thornton Township High School.
Ownership History
Date
Name
Owned For
Owner Type
Purchase Details
Closed on
Dec 28, 2018
Sold by
Gonzalez Pascual
Bought by
Torre Ramon Gonzalez Dela
Current Estimated Value
Home Financials for this Owner
Home Financials are based on the most recent Mortgage that was taken out on this home.
Original Mortgage
$49,000
Outstanding Balance
$37,525
Interest Rate
4.8%
Mortgage Type
New Conventional
Estimated Equity
$87,433
Purchase Details
Closed on
Jun 24, 2010
Sold by
Wells Fargo Bank National Association
Bought by
Gonzalez Pascual
Purchase Details
Closed on
May 17, 2010
Sold by
Henderson
Bought by
Wells Fargo Bank National Association
Purchase Details
Closed on
Jul 14, 1995
Sold by
Wood Selvin D and Guthrie Denise L
Bought by
Henderson Emmett J
Home Financials for this Owner
Home Financials are based on the most recent Mortgage that was taken out on this home.
Original Mortgage
$64,826
Interest Rate
7.5%
Mortgage Type
FHA
Create a Home Valuation Report for This Property
The Home Valuation Report is an in-depth analysis detailing your home's value as well as a comparison with similar homes in the area
Home Values in the Area
Average Home Value in this Area
Purchase History
| Date | Buyer | Sale Price | Title Company |
|---|---|---|---|
| Torre Ramon Gonzalez Dela | $70,000 | Old Republic Title | |
| Gonzalez Pascual | $29,000 | None Available | |
| Wells Fargo Bank National Association | -- | None Available | |
| Henderson Emmett J | $65,000 | -- |
Source: Public Records
Mortgage History
| Date | Status | Borrower | Loan Amount |
|---|---|---|---|
| Open | Torre Ramon Gonzalez Dela | $49,000 | |
| Previous Owner | Henderson Emmett J | $64,826 |
Source: Public Records
Tax History Compared to Growth
Tax History
| Year | Tax Paid | Tax Assessment Tax Assessment Total Assessment is a certain percentage of the fair market value that is determined by local assessors to be the total taxable value of land and additions on the property. | Land | Improvement |
|---|---|---|---|---|
| 2024 | $3,193 | $8,200 | $1,638 | $6,562 |
| 2023 | $1,873 | $8,200 | $1,638 | $6,562 |
| 2022 | $1,873 | $5,724 | $1,386 | $4,338 |
| 2021 | $1,880 | $5,723 | $1,386 | $4,337 |
| 2020 | $2,116 | $5,723 | $1,386 | $4,337 |
| 2019 | $4,590 | $5,915 | $1,260 | $4,655 |
| 2018 | $1,878 | $5,915 | $1,260 | $4,655 |
| 2017 | $1,879 | $5,915 | $1,260 | $4,655 |
| 2016 | $2,428 | $6,248 | $1,134 | $5,114 |
| 2015 | $2,253 | $6,248 | $1,134 | $5,114 |
| 2014 | $2,282 | $6,248 | $1,134 | $5,114 |
| 2013 | $2,480 | $6,706 | $1,134 | $5,572 |
Source: Public Records
Map
Nearby Homes
- 15724 Emerald Ave
- 15736 Lathrop Ave
- 15704 Willard Ave
- 15711 Lowe Ave
- 15920 Carol Ave
- 536 E 155th St
- 15533 Vincennes Rd
- 15708 Park Ave
- 15727 Turlington Ave
- 604 E 154th St
- 16141 Carse Ave
- 15544 Turlington Ave
- 15354 5th Ave
- 15633 Lexington Ave
- 15239 Vincennes Rd
- 630 Belle Ct
- 615 Frances St
- 15211 Vincennes Rd
- 15355 7th Ave
- 15237 4th Ave
- 15722 Woodbridge Ave
- 15728 Woodbridge Ave
- 15736 Woodbridge Ave
- 15716 Woodbridge Ave
- 15725 Carse Ave
- 15731 Carse Ave
- 15719 Carse Ave
- 15719 Carse Ave
- 15740 Woodbridge Ave
- 15740 Woodbridge Ave
- 15733 Carse Ave
- 15717 Carse Ave
- 15735 Carse Ave Unit 1
- 15735 Carse Ave Unit 2
- 15735 Carse Ave
- 15727 Woodbridge Ave
- 15725 Woodbridge Ave
- 15733 Woodbridge Ave
- 15715 Carse Ave
- 15739 Carse Ave