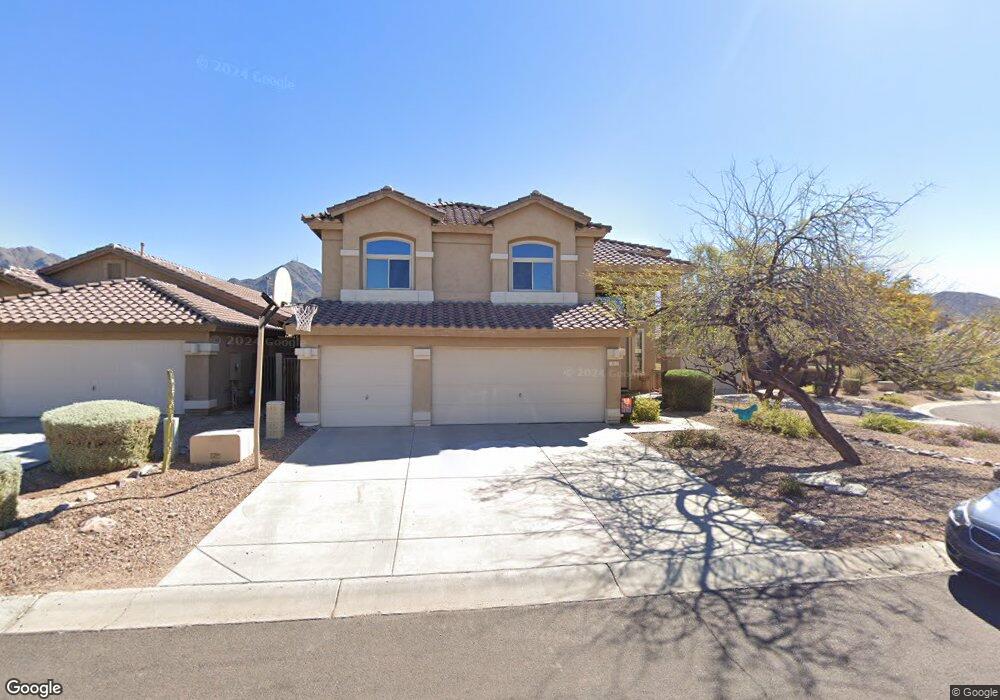
15727 N 104th Place Scottsdale, AZ 85255
McDowell Mountain Ranch NeighborhoodEstimated Value: $939,135 - $1,171,000
5
Beds
3
Baths
2,655
Sq Ft
$408/Sq Ft
Est. Value
About This Home
This home is located at 15727 N 104th Place, Scottsdale, AZ 85255 and is currently estimated at $1,084,284, approximately $408 per square foot. 15727 N 104th Place is a home located in Maricopa County with nearby schools including Desert Canyon Elementary School, Desert Canyon Middle School, and Desert Mountain High School.
Ownership History
Date
Name
Owned For
Owner Type
Purchase Details
Closed on
Sep 28, 2023
Sold by
Perata Kathleen A
Bought by
Perata Kathleen A
Current Estimated Value
Purchase Details
Closed on
May 14, 2010
Sold by
Harding Gregory S and Harding Michelle L
Bought by
Rankin Kathleen A and Perata Danelle N
Home Financials for this Owner
Home Financials are based on the most recent Mortgage that was taken out on this home.
Original Mortgage
$308,000
Interest Rate
5.21%
Mortgage Type
New Conventional
Purchase Details
Closed on
Feb 3, 1998
Sold by
Woodside Homes Sales Corp
Bought by
Harding Gregory S and Harding Michelle L
Home Financials for this Owner
Home Financials are based on the most recent Mortgage that was taken out on this home.
Original Mortgage
$164,050
Interest Rate
6.98%
Mortgage Type
New Conventional
Create a Home Valuation Report for This Property
The Home Valuation Report is an in-depth analysis detailing your home's value as well as a comparison with similar homes in the area
Home Values in the Area
Average Home Value in this Area
Purchase History
| Date | Buyer | Sale Price | Title Company |
|---|---|---|---|
| Perata Kathleen A | -- | None Listed On Document | |
| Rankin Kathleen A | $385,000 | Old Republic Title Agency | |
| Harding Gregory S | $214,060 | Security Title Agency | |
| Woodside Homes Sales Corp | $127,024 | Security Title Agency |
Source: Public Records
Mortgage History
| Date | Status | Borrower | Loan Amount |
|---|---|---|---|
| Previous Owner | Rankin Kathleen A | $308,000 | |
| Previous Owner | Harding Gregory S | $164,050 |
Source: Public Records
Tax History Compared to Growth
Tax History
| Year | Tax Paid | Tax Assessment Tax Assessment Total Assessment is a certain percentage of the fair market value that is determined by local assessors to be the total taxable value of land and additions on the property. | Land | Improvement |
|---|---|---|---|---|
| 2025 | $3,625 | $59,691 | -- | -- |
| 2024 | $3,403 | $56,849 | -- | -- |
| 2023 | $3,403 | $69,580 | $13,910 | $55,670 |
| 2022 | $3,199 | $54,570 | $10,910 | $43,660 |
| 2021 | $3,730 | $51,300 | $10,260 | $41,040 |
| 2020 | $3,721 | $49,450 | $9,890 | $39,560 |
| 2019 | $3,617 | $47,080 | $9,410 | $37,670 |
| 2018 | $3,541 | $45,020 | $9,000 | $36,020 |
| 2017 | $3,353 | $44,130 | $8,820 | $35,310 |
| 2016 | $2,982 | $43,660 | $8,730 | $34,930 |
| 2015 | $3,190 | $41,910 | $8,380 | $33,530 |
Source: Public Records
Map
Nearby Homes
- 10367 E Morning Star Dr
- 15947 N 102nd Place
- 10219 E Le Marche Dr
- 10167 E Tierra Buena Ln
- 10205 E Firewheel Dr
- 16142 N 102nd Way
- 10671 E Caribbean Ln
- 10554 E Blanche Dr
- 10432 E Penstamin Dr
- 10695 E Caribbean Ln
- 10662 E Blanche Dr
- 10746 E Greenway Rd
- 10222 E Blanche Dr
- 10303 E Rosemary Ln
- 10799 E Autumn Sage Dr
- 10473 E Raintree Dr
- 10226 E Pine Valley Rd
- 10546 E Cosmos Cir
- 15072 N 102nd St
- 16420 N Thompson Peak Pkwy Unit 2018
- 10491 E Tierra Buena Ln
- 15709 N 104th Place
- 15745 N 104th Place
- 10486 E Tierra Buena Ln
- 15781 N 104th Place
- 15673 N 104th Place
- 15732 N 104th Place
- 15714 N 104th Place
- 10455 E Tierra Buena Ln
- 15696 N 104th Place
- 15799 N 104th Place
- 15678 N 104th Place
- 10520 E Firewheel Dr
- 10524 E Firewheel Dr
- 10516 E Firewheel Dr
- 15786 N 104th Place
- 15817 N 104th Place
- 15723 N 104th St
- 15741 N 104th St
- 15705 N 104th St