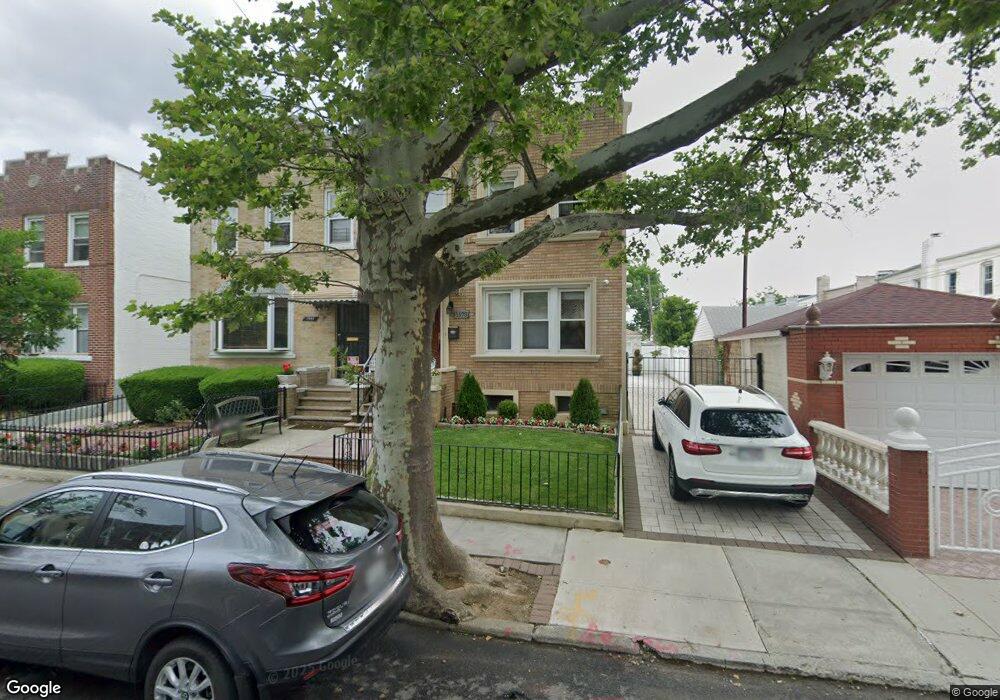
1573 E 32nd St Brooklyn, NY 11234
Marine Park NeighborhoodEstimated Value: $1,028,000 - $1,369,000
--
Bed
--
Bath
2,400
Sq Ft
$478/Sq Ft
Est. Value
About This Home
This home is located at 1573 E 32nd St, Brooklyn, NY 11234 and is currently estimated at $1,147,227, approximately $478 per square foot. 1573 E 32nd St is a home located in Kings County with nearby schools including PS 222 Katherine R Snyder, J.H.S. 278 Marine Park, and James Madison High School.
Ownership History
Date
Name
Owned For
Owner Type
Purchase Details
Closed on
Jun 13, 2012
Sold by
Malhotra Ashwini
Bought by
Nisanov Nison and Nisanova Gyulvera
Current Estimated Value
Home Financials for this Owner
Home Financials are based on the most recent Mortgage that was taken out on this home.
Original Mortgage
$461,000
Outstanding Balance
$319,639
Interest Rate
3.84%
Mortgage Type
New Conventional
Estimated Equity
$827,588
Purchase Details
Closed on
Apr 7, 2000
Sold by
Luisi Anne
Bought by
Berliner William A and Murphy Sarah E
Home Financials for this Owner
Home Financials are based on the most recent Mortgage that was taken out on this home.
Original Mortgage
$170,000
Interest Rate
8.1%
Purchase Details
Closed on
Jan 22, 1999
Sold by
Durso Roy
Bought by
Malhotra Ashwini and Malhotra Sujata
Home Financials for this Owner
Home Financials are based on the most recent Mortgage that was taken out on this home.
Original Mortgage
$165,000
Interest Rate
7.04%
Create a Home Valuation Report for This Property
The Home Valuation Report is an in-depth analysis detailing your home's value as well as a comparison with similar homes in the area
Home Values in the Area
Average Home Value in this Area
Purchase History
| Date | Buyer | Sale Price | Title Company |
|---|---|---|---|
| Nisanov Nison | $615,000 | -- | |
| Berliner William A | $190,000 | First American Title Ins Co | |
| Malhotra Ashwini | $218,000 | Commonwealth Land Title Ins |
Source: Public Records
Mortgage History
| Date | Status | Borrower | Loan Amount |
|---|---|---|---|
| Open | Nisanov Nison | $461,000 | |
| Previous Owner | Berliner William A | $170,000 | |
| Previous Owner | Malhotra Ashwini | $165,000 |
Source: Public Records
Tax History Compared to Growth
Tax History
| Year | Tax Paid | Tax Assessment Tax Assessment Total Assessment is a certain percentage of the fair market value that is determined by local assessors to be the total taxable value of land and additions on the property. | Land | Improvement |
|---|---|---|---|---|
| 2025 | $9,196 | $62,520 | $12,000 | $50,520 |
| 2024 | $9,196 | $67,200 | $12,000 | $55,200 |
| 2023 | $9,228 | $69,180 | $12,000 | $57,180 |
| 2022 | $8,557 | $57,540 | $12,000 | $45,540 |
| 2021 | $8,511 | $52,980 | $12,000 | $40,980 |
| 2020 | $3,991 | $52,920 | $12,000 | $40,920 |
| 2019 | $7,981 | $52,920 | $12,000 | $40,920 |
| 2018 | $7,719 | $37,865 | $10,896 | $26,969 |
| 2017 | $7,282 | $35,722 | $9,339 | $26,383 |
| 2016 | $6,737 | $33,700 | $10,290 | $23,410 |
| 2015 | $3,845 | $31,795 | $10,274 | $21,521 |
| 2014 | $3,845 | $31,795 | $12,318 | $19,477 |
Source: Public Records
Map
Nearby Homes
- 3313 Avenue P
- 1627 E 32nd St
- 1523 E 33rd St
- 1491 E 32nd St
- 1677 E 34th St
- 1544 E 34th St
- 1669 E 32nd St
- 2881 Nostrand Ave Unit 1C
- 3324 Avenue N
- 3152 Kings Hwy
- 1664 E 35th St
- 1638 E 36th St
- 1620 Madison Place
- 2922 Nostrand Ave Unit 5C
- 3222 Kings Hwy
- 3115 Kings Hwy
- 1517 E 34th St
- 3117 Kings Hwy
- 2991 Quentin Rd
- 1506 E 29th St