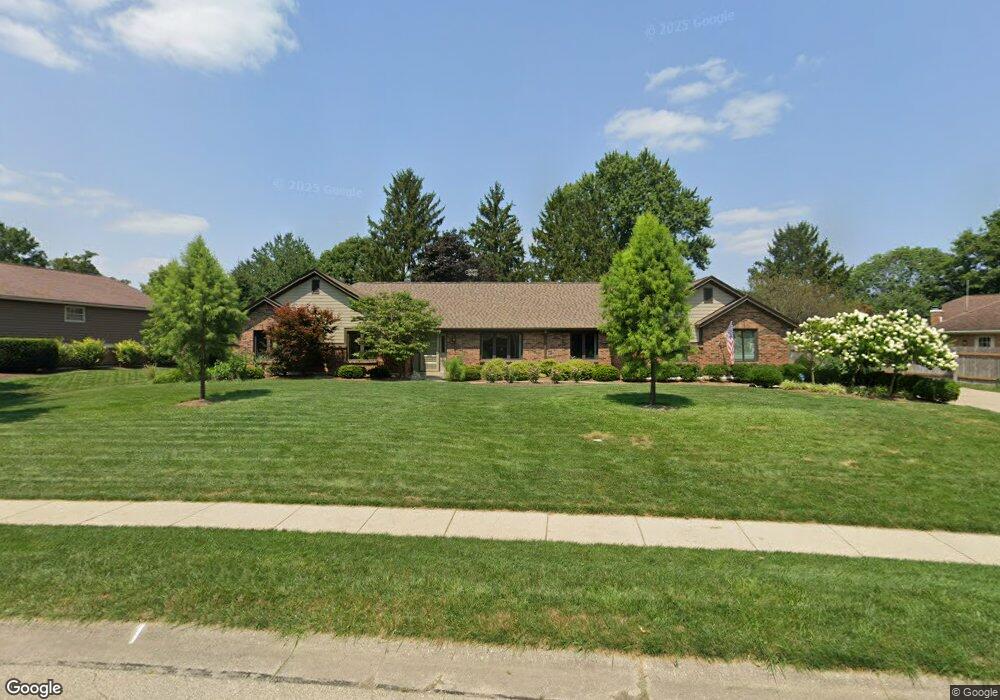
1573 Frontier Ct Dayton, OH 45458
Estimated Value: $450,000 - $484,000
3
Beds
3
Baths
2,821
Sq Ft
$166/Sq Ft
Est. Value
About This Home
This home is located at 1573 Frontier Ct, Dayton, OH 45458 and is currently estimated at $469,488, approximately $166 per square foot. 1573 Frontier Ct is a home located in Montgomery County with nearby schools including Primary Village South, Cline Elementary, and Magsig Middle School.
Ownership History
Date
Name
Owned For
Owner Type
Purchase Details
Closed on
Sep 15, 2023
Sold by
Unknown
Bought by
Minck Real Estate Llc
Current Estimated Value
Purchase Details
Closed on
May 15, 2015
Sold by
Elam Janice F and Elam Janice Faye
Bought by
Schultz Karen L
Purchase Details
Closed on
May 27, 2005
Sold by
Sirva Relocation Llc
Bought by
Elam Billy A and Elam Janice F
Purchase Details
Closed on
May 23, 2005
Sold by
Nelson Joseph R
Bought by
Sirva Relocation Llc
Purchase Details
Closed on
Oct 31, 2001
Sold by
Clay Carmon L and Clay Nellie M
Bought by
Nelson Joseph R
Home Financials for this Owner
Home Financials are based on the most recent Mortgage that was taken out on this home.
Original Mortgage
$180,000
Interest Rate
5%
Create a Home Valuation Report for This Property
The Home Valuation Report is an in-depth analysis detailing your home's value as well as a comparison with similar homes in the area
Home Values in the Area
Average Home Value in this Area
Purchase History
| Date | Buyer | Sale Price | Title Company |
|---|---|---|---|
| Minck Real Estate Llc | $500,000 | None Listed On Document | |
| Schultz Karen L | $245,000 | Landmark Title Agency South | |
| Elam Billy A | $255,000 | -- | |
| Sirva Relocation Llc | $255,000 | -- | |
| Nelson Joseph R | $225,000 | -- |
Source: Public Records
Mortgage History
| Date | Status | Borrower | Loan Amount |
|---|---|---|---|
| Previous Owner | Nelson Joseph R | $180,000 | |
| Previous Owner | Nelson Joseph R | $22,000 |
Source: Public Records
Tax History Compared to Growth
Tax History
| Year | Tax Paid | Tax Assessment Tax Assessment Total Assessment is a certain percentage of the fair market value that is determined by local assessors to be the total taxable value of land and additions on the property. | Land | Improvement |
|---|---|---|---|---|
| 2024 | $7,790 | $126,470 | $27,370 | $99,100 |
| 2023 | $7,790 | $126,470 | $27,370 | $99,100 |
| 2022 | $7,246 | $93,070 | $20,130 | $72,940 |
| 2021 | $7,266 | $93,070 | $20,130 | $72,940 |
| 2020 | $7,260 | $93,070 | $20,130 | $72,940 |
| 2019 | $7,393 | $84,750 | $17,500 | $67,250 |
| 2018 | $6,603 | $84,750 | $17,500 | $67,250 |
| 2017 | $6,532 | $84,750 | $17,500 | $67,250 |
| 2016 | $6,270 | $76,660 | $17,500 | $59,160 |
| 2015 | $5,467 | $76,660 | $17,500 | $59,160 |
| 2014 | $5,467 | $76,660 | $17,500 | $59,160 |
| 2012 | -- | $67,500 | $17,500 | $50,000 |
Source: Public Records
Map
Nearby Homes
- 9139 Indian Springs Ct
- 9038 Woodstream Ln
- 8580 Hide a Way Ln
- 1947 Horseshoe Bend
- 1248 Timberhawk Trail
- 1071 Star Valley Ct
- 1943 Horseshoe Bend
- 8977 Slagle Rd
- 9354 Buckboard Dr
- 1886 Horseshoe Bend
- 1890 Horseshoe Bend
- 2006 Washington Creek Ln
- 9258 Clyo Rd
- 553 E Spring Valley Pike
- 2044 Meadowside Ln
- 9882 Saddle Creek Trail
- 2037 Stablehand Dr
- 435 Clareridge Ln
- 9266 Ridings Blvd
- 9452 Sugar Bend Trail
- 9171 N Creek Ln
- 1563 Frontier Ct
- 9063 Academy View Ct
- 9053 Academy View Ct
- 9047 Payne Farm Ln
- 9174 N Creek Ln
- 9073 Academy View Ct
- 1553 Frontier Ct
- 9043 Academy View Ct
- 9184 N Creek Ln
- 9116 N Creek Ln
- 1547 Frontier Ct
- 1550 Frontier Ct
- 9195 N Creek Ln
- 9042 Academy View Ct
- 9087 Payne Farm Ln
- 9194 N Creek Ln
- 1555 Shaker Ct
- 9072 Academy View Ct
- 9033 Academy View Ct