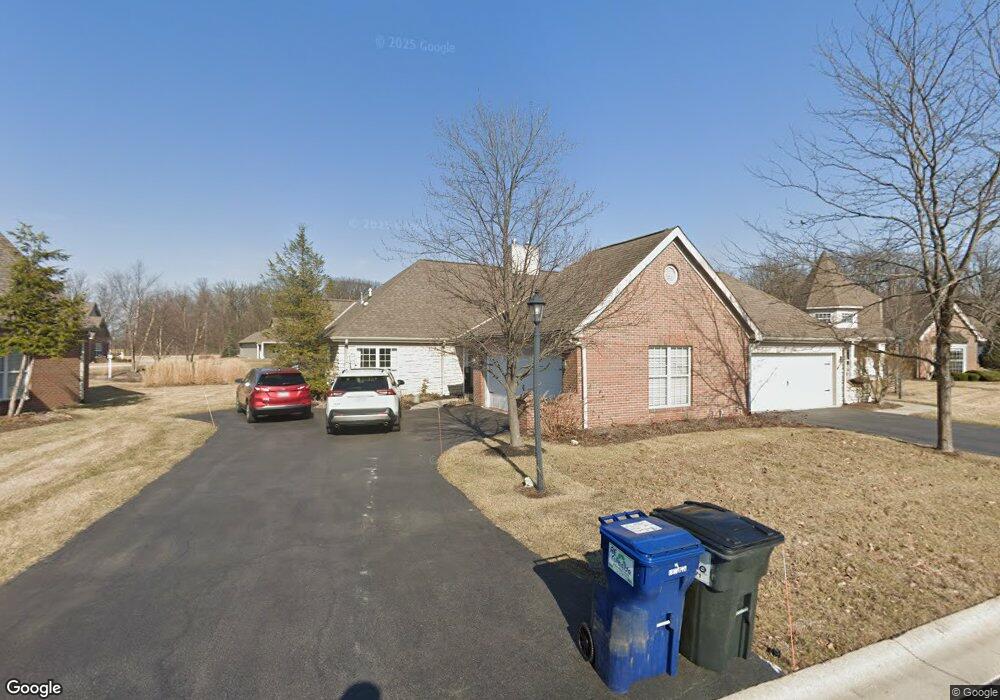
15738 Mahogany Trail Findlay, OH 45840
Estimated Value: $280,637 - $304,000
3
Beds
2
Baths
1,442
Sq Ft
$201/Sq Ft
Est. Value
About This Home
This home is located at 15738 Mahogany Trail, Findlay, OH 45840 and is currently estimated at $290,409, approximately $201 per square foot. 15738 Mahogany Trail is a home located in Hancock County with nearby schools including Van Buren Elementary School, Van Buren Middle School, and Van Buren High School.
Ownership History
Date
Name
Owned For
Owner Type
Purchase Details
Closed on
Jul 13, 2018
Sold by
Master Donald C
Bought by
Combs Jody S
Current Estimated Value
Home Financials for this Owner
Home Financials are based on the most recent Mortgage that was taken out on this home.
Original Mortgage
$160,000
Interest Rate
4.87%
Mortgage Type
Adjustable Rate Mortgage/ARM
Purchase Details
Closed on
Jul 10, 2018
Sold by
Fifth Third Bank
Bought by
Combs Jody S and Masters Donald C
Home Financials for this Owner
Home Financials are based on the most recent Mortgage that was taken out on this home.
Original Mortgage
$160,000
Interest Rate
4.87%
Mortgage Type
Adjustable Rate Mortgage/ARM
Purchase Details
Closed on
Oct 31, 2008
Sold by
Estate Of Ruth L Nye
Bought by
Nye John G and Fifth Third Bank
Purchase Details
Closed on
Jul 19, 2005
Sold by
Birchaven Estates At Eastern Woods Ltd
Bought by
Nye John G and John G Nye Trust
Create a Home Valuation Report for This Property
The Home Valuation Report is an in-depth analysis detailing your home's value as well as a comparison with similar homes in the area
Home Values in the Area
Average Home Value in this Area
Purchase History
| Date | Buyer | Sale Price | Title Company |
|---|---|---|---|
| Combs Jody S | -- | Assured Title Agency | |
| Combs Jody S | $160,000 | Assured Title Agency | |
| Nye John G | -- | None Available | |
| Nye John G | $221,933 | Assured Title |
Source: Public Records
Mortgage History
| Date | Status | Borrower | Loan Amount |
|---|---|---|---|
| Previous Owner | Combs Jody S | $160,000 |
Source: Public Records
Tax History Compared to Growth
Tax History
| Year | Tax Paid | Tax Assessment Tax Assessment Total Assessment is a certain percentage of the fair market value that is determined by local assessors to be the total taxable value of land and additions on the property. | Land | Improvement |
|---|---|---|---|---|
| 2024 | $1,936 | $71,800 | $3,680 | $68,120 |
| 2023 | $1,946 | $71,800 | $3,680 | $68,120 |
| 2022 | $1,960 | $71,800 | $3,680 | $68,120 |
| 2021 | $1,715 | $60,850 | $2,800 | $58,050 |
| 2020 | $1,713 | $60,850 | $2,800 | $58,050 |
| 2019 | $2,071 | $60,850 | $2,800 | $58,050 |
| 2018 | $2,096 | $60,850 | $2,800 | $58,050 |
| 2017 | $1,801 | $60,850 | $2,800 | $58,050 |
| 2016 | $1,757 | $60,850 | $2,800 | $58,050 |
| 2015 | $1,433 | $50,620 | $2,800 | $47,820 |
| 2014 | $1,439 | $50,620 | $2,800 | $47,820 |
| 2012 | $1,564 | $50,620 | $2,800 | $47,820 |
Source: Public Records
Map
Nearby Homes
- 15711 Mahogany Trail
- 15680 Thornwood Dr
- 6908 Township Road 212
- 7507 Township Road 212
- 0 Hickory Ln Unit 6133896
- 0 Hickory Ln Unit 1 307878
- 0 Hickory Ln Unit 20252999
- 0 E Us Route 224
- 15329 E Us Route 224
- 7712 E Watermark Dr
- 15818 Forest Ln
- 16169 Forest Ln
- 8405 Indian Lake Dr
- 0 Meadowview Dr
- 665 Meadowview Dr
- 8419 E Woodland Trail
- 8457 Lakewood Dr
- 8478 Indian Lake Dr
- 2024 Silverstone Dr
- 845 Fox Run Rd
- 15740 Mahogany Trail Unit 16B
- 15730 Mahogany Trail
- 15728 Mahogany Trail
- 15728 Mahogany Tr
- 15750 Mahogany Trail
- 15715 Mahogany Trail Unit U10-C
- 15717 Mahogany Trail
- 7060 Eastern Woods Pkwy
- 7070 Eastern Woods Pkwy
- 15776 Mahogany Trail
- 15711 Mahogany Trail Unit U10-D
- 15713 Mahogany Trail
- 15713 Mahogany Trail Unit U10-A
- 7113 Eastern Woods Pkwy
- 15720 Mahogany Tr
- 15720 Mahogany Trail
- 15741 Teak Ct
- 15780 Mahogany Trail
- 15705 Mahogany Tr
- 15705 Mahogany Trail Unit U11