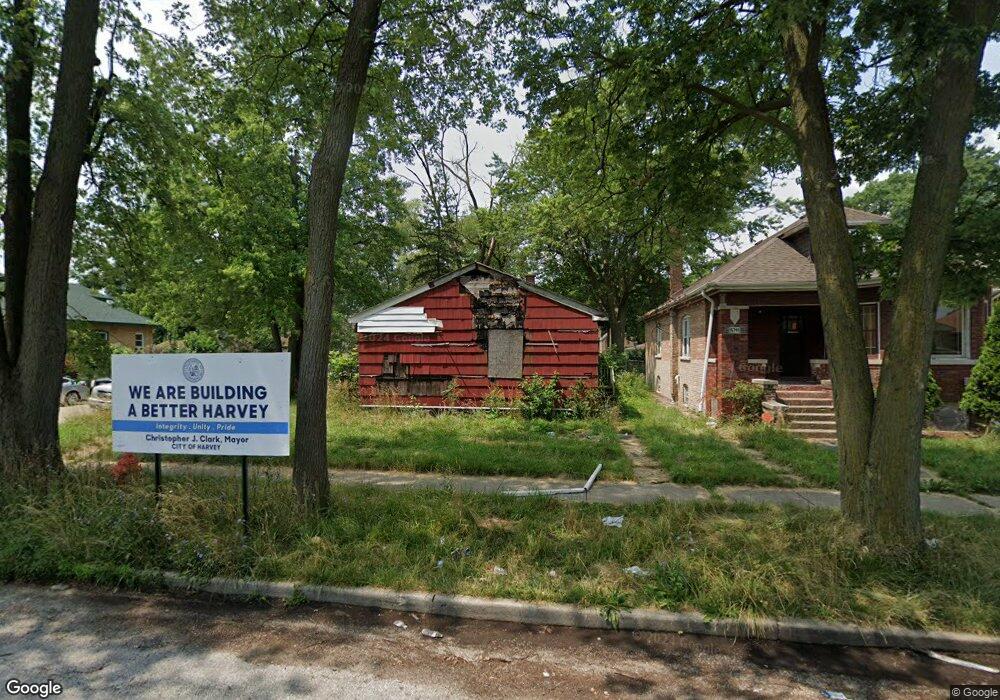
15746 Marshfield Ave Harvey, IL 60426
Estimated Value: $104,000 - $142,000
3
Beds
1
Bath
1,050
Sq Ft
$111/Sq Ft
Est. Value
About This Home
This home is located at 15746 Marshfield Ave, Harvey, IL 60426 and is currently estimated at $116,416, approximately $110 per square foot. 15746 Marshfield Ave is a home located in Cook County with nearby schools including Maya Angelou Elementary School, Brooks Middle School, and Thornton Township High School.
Ownership History
Date
Name
Owned For
Owner Type
Purchase Details
Closed on
Jan 29, 2004
Sold by
Gardner Otis
Bought by
Taylor Fowler Liane
Current Estimated Value
Home Financials for this Owner
Home Financials are based on the most recent Mortgage that was taken out on this home.
Original Mortgage
$66,400
Outstanding Balance
$31,314
Interest Rate
5.91%
Mortgage Type
Unknown
Estimated Equity
$85,102
Purchase Details
Closed on
Jan 29, 2003
Sold by
Fairbanks Capital Corp
Bought by
Gardner Otis
Purchase Details
Closed on
Dec 9, 2002
Sold by
Murphy Antoinette M
Bought by
Fairbanks Capital Corp and Homecomings Financial Network Inc
Purchase Details
Closed on
Aug 28, 1996
Sold by
Wilkerson Pinkie L and Bloodsaw Pinkie L
Bought by
Murphy Antoinette M
Home Financials for this Owner
Home Financials are based on the most recent Mortgage that was taken out on this home.
Original Mortgage
$46,350
Interest Rate
8.29%
Create a Home Valuation Report for This Property
The Home Valuation Report is an in-depth analysis detailing your home's value as well as a comparison with similar homes in the area
Home Values in the Area
Average Home Value in this Area
Purchase History
| Date | Buyer | Sale Price | Title Company |
|---|---|---|---|
| Taylor Fowler Liane | $83,000 | Millennium Title Group | |
| Gardner Otis | $25,000 | -- | |
| Fairbanks Capital Corp | -- | -- | |
| Murphy Antoinette M | $51,500 | -- |
Source: Public Records
Mortgage History
| Date | Status | Borrower | Loan Amount |
|---|---|---|---|
| Open | Taylor Fowler Liane | $66,400 | |
| Previous Owner | Murphy Antoinette M | $46,350 | |
| Closed | Taylor Fowler Liane | $16,400 |
Source: Public Records
Tax History Compared to Growth
Tax History
| Year | Tax Paid | Tax Assessment Tax Assessment Total Assessment is a certain percentage of the fair market value that is determined by local assessors to be the total taxable value of land and additions on the property. | Land | Improvement |
|---|---|---|---|---|
| 2024 | $1,231 | $5,200 | $1,409 | $3,791 |
| 2023 | $723 | $5,200 | $1,409 | $3,791 |
| 2022 | $723 | $4,311 | $1,409 | $2,902 |
| 2021 | $770 | $4,310 | $1,409 | $2,901 |
| 2020 | $975 | $4,310 | $1,409 | $2,901 |
| 2019 | $1,969 | $5,967 | $1,281 | $4,686 |
| 2018 | $1,917 | $5,967 | $1,281 | $4,686 |
| 2017 | $1,917 | $5,967 | $1,281 | $4,686 |
| 2016 | $1,447 | $4,733 | $1,152 | $3,581 |
| 2015 | $1,311 | $4,733 | $1,152 | $3,581 |
| 2014 | $1,342 | $4,733 | $1,152 | $3,581 |
| 2013 | $2,582 | $6,874 | $1,152 | $5,722 |
Source: Public Records
Map
Nearby Homes
- 15734 Marshfield Ave
- 15702 Marshfield Ave
- 28 E 157th St
- 15603 Marshfield Ave
- 15626 Myrtle Ave
- 15944 Paulina St
- 15633 Myrtle Ave
- 15812 Lincoln Ave
- 69 E 159th St
- 15545 Lincoln Ave
- 15612 Loomis Ave
- 46 E 155th St
- 15 E 155th St
- 16019 Wood St
- 112 W 155th St
- 15633 Lexington Ave
- 16118 Paulina St
- 16018 Loomis Ave
- 16122 Ashland Ave
- 48 E 154th St
- 15744 Marshfield Ave
- 15740 Marshfield Ave
- 15738 Marshfield Ave
- 15800 Marshfield Ave
- 15747 Paulina St
- 15745 Paulina St
- 15802 Marshfield Ave
- 15741 Paulina St
- 15732 Marshfield Ave
- 15739 Paulina St
- 15801 Paulina St
- 15808 Marshfield Ave
- 15737 Paulina St
- 15803 Paulina St
- 15739 Marshfield Ave
- 15735 Paulina St
- 15801 Marshfield Ave
- 15805 Paulina St
- 15726 Marshfield Ave