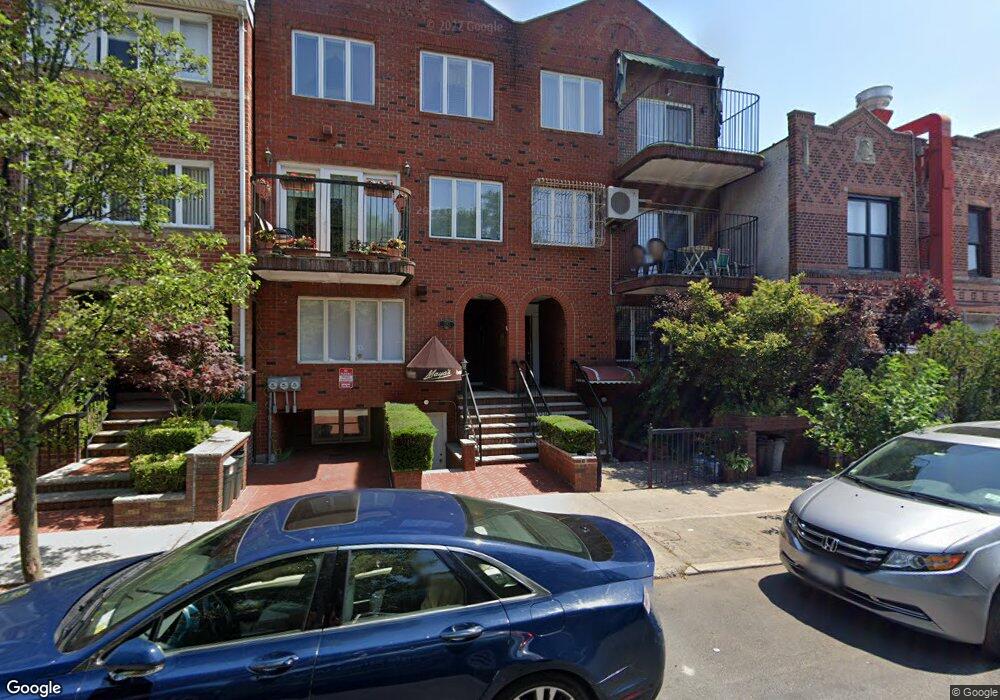
1575 49th St Unit 1 Brooklyn, NY 11219
Borough Park NeighborhoodEstimated Value: $1,016,000 - $1,263,000
--
Bed
--
Bath
1,240
Sq Ft
$902/Sq Ft
Est. Value
About This Home
This home is located at 1575 49th St Unit 1, Brooklyn, NY 11219 and is currently estimated at $1,118,366, approximately $901 per square foot. 1575 49th St Unit 1 is a home located in Kings County with nearby schools including P.S. 164 Caesar Rodney School, I.S. 223 The Montauk, and Franklin Delano Roosevelt High School.
Ownership History
Date
Name
Owned For
Owner Type
Purchase Details
Closed on
Dec 27, 2022
Sold by
Rosenblatt Chaim and Rosenblatt Michly
Bought by
Chaim Y Rosenblatt Trustee and Cm Rosenblatt Legacy Trust
Current Estimated Value
Purchase Details
Closed on
Dec 29, 2005
Sold by
Herskowitz Eliezer
Bought by
Rosenblatt Chaim and Rosenblatt Michly
Purchase Details
Closed on
Oct 7, 1997
Sold by
Golevenzitz Arie
Bought by
Herskowitz Eliezer
Purchase Details
Closed on
Feb 9, 1995
Sold by
Gottlieb Elazar
Bought by
Golevenzitz Arie and Golevenzitz Yuta
Home Financials for this Owner
Home Financials are based on the most recent Mortgage that was taken out on this home.
Original Mortgage
$162,000
Interest Rate
9.19%
Create a Home Valuation Report for This Property
The Home Valuation Report is an in-depth analysis detailing your home's value as well as a comparison with similar homes in the area
Home Values in the Area
Average Home Value in this Area
Purchase History
| Date | Buyer | Sale Price | Title Company |
|---|---|---|---|
| Chaim Y Rosenblatt Trustee | -- | -- | |
| Chaim Y Rosenblatt Trustee | -- | -- | |
| Rosenblatt Chaim | -- | -- | |
| Rosenblatt Chaim | -- | -- | |
| Herskowitz Eliezer | $210,000 | First American Title Ins Co | |
| Herskowitz Eliezer | $210,000 | First American Title Ins Co | |
| Golevenzitz Arie | -- | Commonwealth Land Title Ins | |
| Golevenzitz Arie | -- | Commonwealth Land Title Ins |
Source: Public Records
Mortgage History
| Date | Status | Borrower | Loan Amount |
|---|---|---|---|
| Previous Owner | Golevenzitz Arie | $162,000 |
Source: Public Records
Tax History Compared to Growth
Tax History
| Year | Tax Paid | Tax Assessment Tax Assessment Total Assessment is a certain percentage of the fair market value that is determined by local assessors to be the total taxable value of land and additions on the property. | Land | Improvement |
|---|---|---|---|---|
| 2025 | $4,633 | $66,376 | $3,077 | $63,299 |
| 2024 | $4,633 | $52,427 | $3,077 | $49,350 |
| 2023 | $4,419 | $46,336 | $3,077 | $43,259 |
| 2022 | $4,098 | $42,719 | $3,077 | $39,642 |
| 2021 | $4,076 | $39,726 | $3,077 | $36,649 |
| 2020 | $2,026 | $39,476 | $3,077 | $36,399 |
| 2019 | $4,021 | $40,904 | $3,077 | $37,827 |
| 2018 | $3,697 | $18,134 | $1,370 | $16,764 |
| 2017 | $3,487 | $17,108 | $1,395 | $15,713 |
| 2016 | $3,227 | $16,140 | $1,770 | $14,370 |
| 2015 | $1,947 | $16,140 | $2,142 | $13,998 |
| 2014 | $1,947 | $16,018 | $2,551 | $13,467 |
Source: Public Records
Map
Nearby Homes
- 5401 15th Ave
- 1768 55th St
- 1358 53rd St Unit 2B
- 1772 55th St
- 4924 13th Ave
- 5313 13th Ave
- 819 McDonald Ave
- 1917 51st St
- 1553 39th St
- 1551 39th St
- 755 McDonald Ave
- 751 McDonald Ave
- 5812 New Utrecht Ave
- 1240 43rd St
- 302 Ditmas Ave
- 304 Ditmas Ave
- 306 Ditmas Ave
- 311 Ditmas Ave
- 649 E 3rd St
- 734 E 5th St Unit 4L
- 1575 49th St Unit 1
- 1575 49th St Unit 1
- 1575 49th St
- 1575 49th St Unit 2
- 1575 49th St Unit 3
- 1573 49th St
- 4820 16th Ave
- 1569 49th St
- 4822 16th Ave
- 4814-4816 16th Ave
- 4824 16th Ave
- 1567 49th St
- 1576-1578 48th St
- 1563 49th St Unit 5
- 1563 49th St Unit 4
- 1563 49th St Unit 3
- 1563 49th St
- 1563 49th St Unit 2
- 1563 49th St Unit 1
- 4804 16th Ave