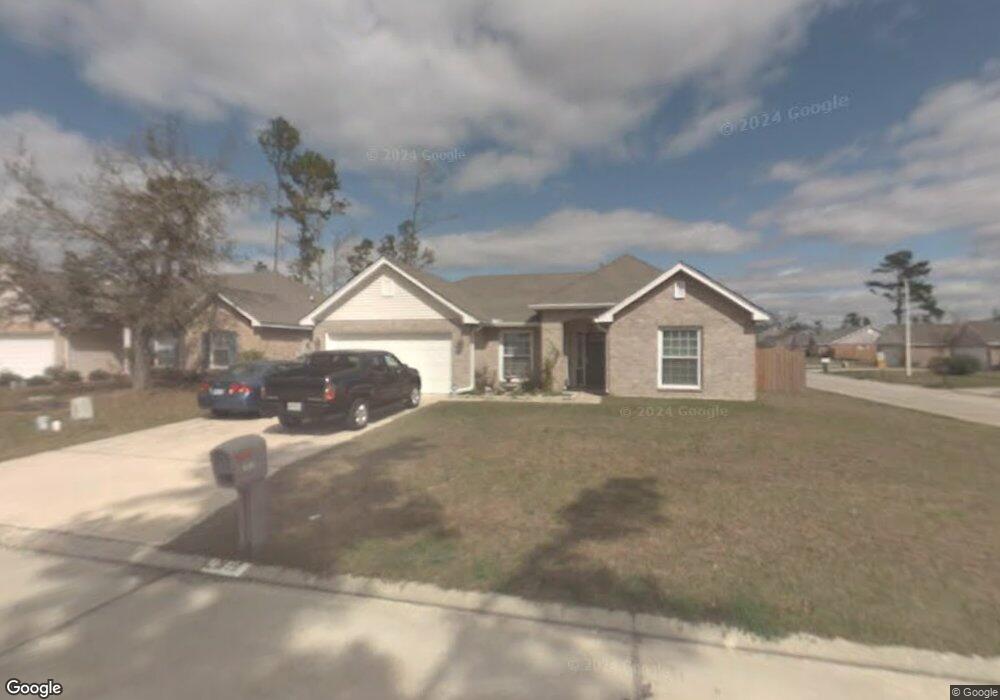
1575 Chancer Ct Slidell, LA 70461
Estimated Value: $186,000 - $220,000
3
Beds
2
Baths
1,661
Sq Ft
$118/Sq Ft
Est. Value
About This Home
This home is located at 1575 Chancer Ct, Slidell, LA 70461 and is currently estimated at $195,829, approximately $117 per square foot. 1575 Chancer Ct is a home located in St. Tammany Parish with nearby schools including W.L. Abney Elementary School, St. Tammany Junior High School, and Salmen High School.
Ownership History
Date
Name
Owned For
Owner Type
Purchase Details
Closed on
Jul 22, 2024
Sold by
Bonaccorso James S
Bought by
Bonaccorso Chan Le
Current Estimated Value
Purchase Details
Closed on
Apr 30, 2021
Sold by
Page Michael S
Bought by
Bonaccorso James E
Home Financials for this Owner
Home Financials are based on the most recent Mortgage that was taken out on this home.
Original Mortgage
$144,500
Interest Rate
3%
Mortgage Type
New Conventional
Purchase Details
Closed on
May 15, 2009
Sold by
Landherr Heather and Landherr Samuel C
Bought by
Page Michael S
Home Financials for this Owner
Home Financials are based on the most recent Mortgage that was taken out on this home.
Original Mortgage
$155,268
Interest Rate
4.77%
Mortgage Type
VA
Create a Home Valuation Report for This Property
The Home Valuation Report is an in-depth analysis detailing your home's value as well as a comparison with similar homes in the area
Home Values in the Area
Average Home Value in this Area
Purchase History
| Date | Buyer | Sale Price | Title Company |
|---|---|---|---|
| Bonaccorso Chan Le | -- | None Listed On Document | |
| Bonaccorso James E | $170,000 | Fidelity National Title Insu | |
| Page Michael S | $152,000 | Mahony Title & Land Services |
Source: Public Records
Mortgage History
| Date | Status | Borrower | Loan Amount |
|---|---|---|---|
| Previous Owner | Bonaccorso James E | $144,500 | |
| Previous Owner | Page Michael S | $155,268 |
Source: Public Records
Tax History
| Year | Tax Paid | Tax Assessment Tax Assessment Total Assessment is a certain percentage of the fair market value that is determined by local assessors to be the total taxable value of land and additions on the property. | Land | Improvement |
|---|---|---|---|---|
| 2025 | $2,367 | $16,519 | $1,900 | $14,619 |
| 2024 | $2,367 | $16,519 | $1,900 | $14,619 |
| 2023 | $2,453 | $15,513 | $2,000 | $13,513 |
| 2022 | $131,024 | $15,513 | $2,000 | $13,513 |
| 2021 | $1,309 | $15,513 | $2,000 | $13,513 |
| 2020 | $1,303 | $15,513 | $2,000 | $13,513 |
| 2019 | $2,212 | $13,942 | $1,560 | $12,382 |
| 2018 | $2,220 | $13,942 | $1,560 | $12,382 |
| 2017 | $2,234 | $13,942 | $1,560 | $12,382 |
| 2016 | $2,283 | $13,942 | $1,560 | $12,382 |
| 2015 | $1,093 | $13,406 | $1,500 | $11,906 |
| 2014 | $1,075 | $13,406 | $1,500 | $11,906 |
| 2013 | -- | $13,406 | $1,500 | $11,906 |
Source: Public Records
Map
Nearby Homes
- 1621 Shylock Dr
- 1637 Shylock Dr
- 1243 Admiral Nelson Dr
- 1420 Admiral Nelson Dr
- 1611 Dunkirk St
- 1409 Kings Row
- 1409 Kings Row None
- 1332 Denmark Ct
- 105 Foxcroft Dr
- 128 Marilyn Dr
- 130 Trafalgar Square
- 309 Sugar Tree Ct
- 696 Voters Rd
- LOT C5 Bella Sera Ln
- Lot C4 Bella Sera Ln
- Lot C1 Bella Sera Ln
- 4670 Marais River Dr
- 203 Brookhaven Ct
- 1575 Chancer Ct
- 1575 Chancer Ln
- 1571 Chancer Ct
- 1571 Chancer Ln
- 1567 Chancer Ct
- 1548 Barrymore St
- 1517 E Devonshire St
- 1517 Devonshire Dr
- 1513 Devonshire Other
- 1513 Devonshire Dr
- 1576 Chancer Ct
- 1572 Chancer Ct
- 1572 Chancer Ct
- 1540 Barrymore St
- 1509 Devonshire Dr
- 1563 Chancer Ct
- 1568 Chancer Ct
- 1568 Chancer Ct
- 1602 Chancer Ln
- 1505 Devonshire Dr
Your Personal Tour Guide
Ask me questions while you tour the home.