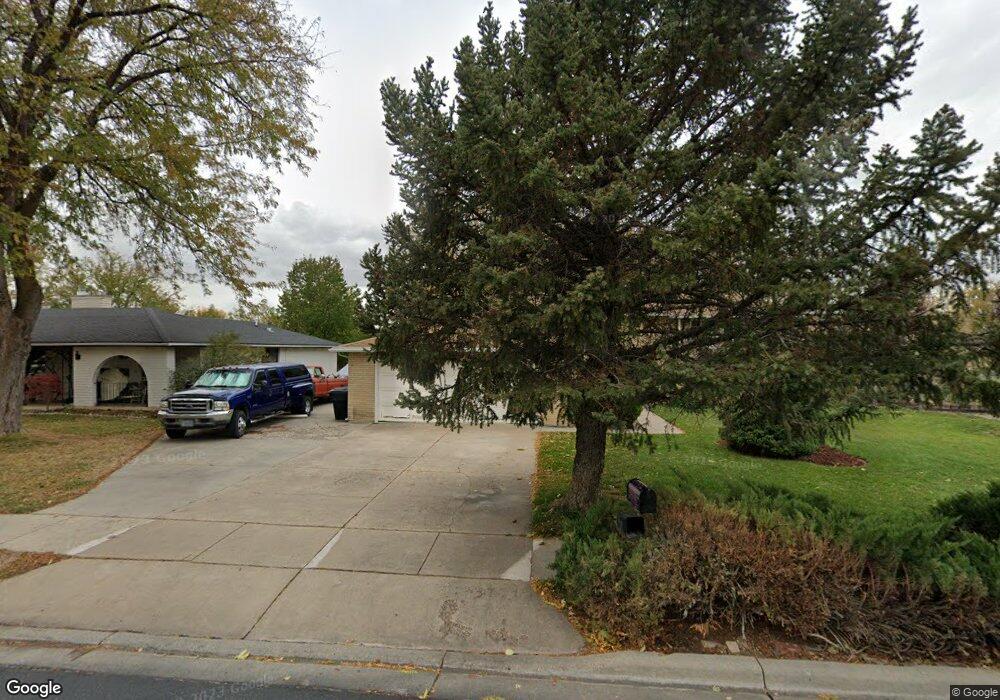
1575 N 600 W West Bountiful, UT 84087
Estimated Value: $505,025 - $538,000
3
Beds
2
Baths
1,330
Sq Ft
$392/Sq Ft
Est. Value
About This Home
This home is located at 1575 N 600 W, West Bountiful, UT 84087 and is currently estimated at $521,256, approximately $391 per square foot. 1575 N 600 W is a home located in Davis County with nearby schools including West Bountiful Elementary School, Bountiful Junior High School, and Viewmont High School.
Ownership History
Date
Name
Owned For
Owner Type
Purchase Details
Closed on
Jun 4, 2025
Sold by
Freestone Ronald L and Freestone Peggie May
Bought by
Freestone
Current Estimated Value
Purchase Details
Closed on
Dec 8, 2004
Sold by
Froestone Ronald L and Froestone Pegoie L
Bought by
Frestone Ronald L and Frestone Peggie L
Create a Home Valuation Report for This Property
The Home Valuation Report is an in-depth analysis detailing your home's value as well as a comparison with similar homes in the area
Home Values in the Area
Average Home Value in this Area
Purchase History
| Date | Buyer | Sale Price | Title Company |
|---|---|---|---|
| Freestone | -- | None Listed On Document | |
| Frestone Ronald L | -- | Merdian Title Company |
Source: Public Records
Mortgage History
| Date | Status | Borrower | Loan Amount |
|---|---|---|---|
| Closed | Frestone Ronald L | $0 |
Source: Public Records
Tax History Compared to Growth
Tax History
| Year | Tax Paid | Tax Assessment Tax Assessment Total Assessment is a certain percentage of the fair market value that is determined by local assessors to be the total taxable value of land and additions on the property. | Land | Improvement |
|---|---|---|---|---|
| 2025 | $2,933 | $255,750 | $147,755 | $107,995 |
| 2024 | $2,742 | $244,750 | $121,727 | $123,023 |
| 2023 | $2,643 | $433,000 | $228,681 | $204,319 |
| 2022 | $2,715 | $249,150 | $110,957 | $138,193 |
| 2021 | $2,518 | $355,000 | $152,062 | $202,938 |
| 2020 | $2,199 | $306,000 | $139,220 | $166,780 |
| 2019 | $2,162 | $298,000 | $138,999 | $159,001 |
| 2018 | $2,038 | $277,000 | $136,958 | $140,042 |
| 2016 | $1,734 | $127,710 | $38,053 | $89,657 |
| 2015 | $1,661 | $116,215 | $38,053 | $78,162 |
| 2014 | $1,567 | $112,619 | $38,053 | $74,566 |
| 2013 | -- | $102,639 | $32,335 | $70,304 |
Source: Public Records
Map
Nearby Homes
- 637 W 1600 N
- Lincoln Farmhouse Plan at Belmont Farms
- Belmont Traditional Plan at Belmont Farms
- Hampton Traditional Plan at Belmont Farms
- 1503 N 300 W
- 789 W 1950 N
- 580 W 2125 N
- 825 W 1320 N
- 239 Lyman Ln
- 2035 N 800 W
- 235 W 1400 N
- 366 W 1000 N
- 234 Leah Cir
- 215 Lyman Ln
- 204 Lyman Ln
- 1552 N 200 W
- 1410 N 200 W
- 420 Rawlins Cir
- 1260 N 200 W
- 1194 N 200 W