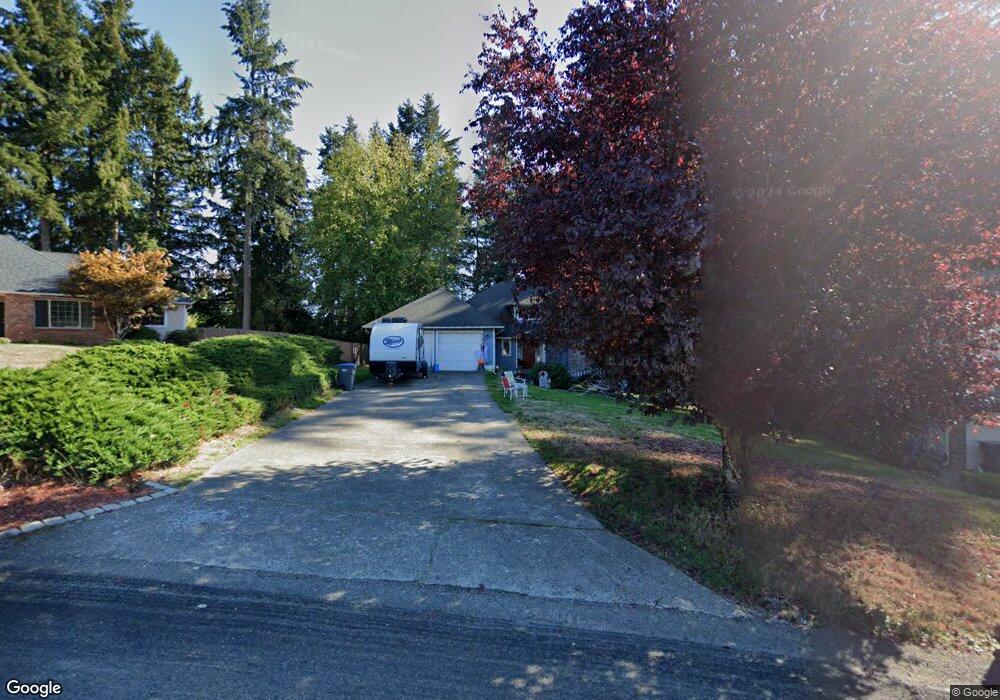
1575 NW Red Oaks Ct Bremerton, WA 98311
Estimated Value: $582,496 - $677,000
3
Beds
3
Baths
2,007
Sq Ft
$307/Sq Ft
Est. Value
About This Home
This home is located at 1575 NW Red Oaks Ct, Bremerton, WA 98311 and is currently estimated at $615,874, approximately $306 per square foot. 1575 NW Red Oaks Ct is a home located in Kitsap County with nearby schools including Woodlands Elementary School, Fairview Middle School, and Olympic High School.
Ownership History
Date
Name
Owned For
Owner Type
Purchase Details
Closed on
Jul 5, 2005
Sold by
Mannila Sandy P
Bought by
Lightfoot Edward M and Yeregui Amaia M
Current Estimated Value
Purchase Details
Closed on
Dec 26, 2002
Sold by
Mannila Charles J and Mannila Sandy P
Bought by
Sandy P Mannila Trust
Purchase Details
Closed on
May 7, 2002
Sold by
Pelan William J and Pelan Karin E
Bought by
Mannila Charles J and Mannila Sandy P
Home Financials for this Owner
Home Financials are based on the most recent Mortgage that was taken out on this home.
Original Mortgage
$164,000
Interest Rate
7.18%
Purchase Details
Closed on
Apr 22, 1909
Sold by
Jennings Charles R and Jennings Margaret C
Bought by
Pelan William J and Pelan Karin E
Home Financials for this Owner
Home Financials are based on the most recent Mortgage that was taken out on this home.
Original Mortgage
$136,800
Interest Rate
6.37%
Create a Home Valuation Report for This Property
The Home Valuation Report is an in-depth analysis detailing your home's value as well as a comparison with similar homes in the area
Home Values in the Area
Average Home Value in this Area
Purchase History
| Date | Buyer | Sale Price | Title Company |
|---|---|---|---|
| Lightfoot Edward M | $326,280 | Pacific Nw Title | |
| Sandy P Mannila Trust | -- | -- | |
| Mannila Charles J | $205,000 | Land Title Co | |
| Pelan William J | $171,000 | Transnation Title Insurance |
Source: Public Records
Mortgage History
| Date | Status | Borrower | Loan Amount |
|---|---|---|---|
| Previous Owner | Mannila Charles J | $164,000 | |
| Previous Owner | Pelan William J | $136,800 |
Source: Public Records
Tax History Compared to Growth
Tax History
| Year | Tax Paid | Tax Assessment Tax Assessment Total Assessment is a certain percentage of the fair market value that is determined by local assessors to be the total taxable value of land and additions on the property. | Land | Improvement |
|---|---|---|---|---|
| 2026 | $4,846 | $521,870 | $126,520 | $395,350 |
| 2025 | $4,846 | $521,870 | $126,520 | $395,350 |
| 2024 | $4,712 | $521,870 | $126,520 | $395,350 |
| 2023 | $4,729 | $521,870 | $126,520 | $395,350 |
| 2022 | $4,443 | $432,000 | $104,560 | $327,440 |
| 2021 | $4,225 | $390,830 | $77,760 | $313,070 |
| 2020 | $3,943 | $369,300 | $73,380 | $295,920 |
| 2019 | $3,838 | $348,410 | $66,260 | $282,150 |
| 2018 | $4,128 | $289,510 | $54,760 | $234,750 |
| 2017 | $3,652 | $289,510 | $54,760 | $234,750 |
| 2016 | $3,532 | $258,810 | $48,890 | $209,920 |
| 2015 | $3,584 | $274,700 | $54,160 | $220,540 |
| 2014 | -- | $260,920 | $54,160 | $206,760 |
| 2013 | -- | $260,920 | $54,160 | $206,760 |
Source: Public Records
Map
Nearby Homes
- 6421 Tracyton Blvd NW
- 7029 Parkdale Dr NW
- 797 NW Ashford Loop
- 6441 Holland Rd NW
- 6190 Holland Rd NW
- 156 NE Zodiac Ln
- 6530 Newaukum Place NE
- 6630 NE Aquarius Ln
- 6748 Scorpio Ln NE
- 404 NE Saturn Ln
- 425 NE Saturn Ln
- 6347 Hamma Ln NE
- 535 NE Saturn Ln
- 102 NE Shadowhawk Ln
- 250 NE Silver Pine Dr
- 1210 NW Huckle Dr
- 154 NE Shadowhawk Ln
- 168 NE Shadowhawk Ln
- 192 NE Shadowhawk Ln
- 204 NE Shadowhawk Ln
- 1573 NW Red Oaks Ct
- 1577 NW Red Oaks Ct
- 6881 Fairside Place NW
- 6865 Fairside Place NW
- 1571 NW Red Oaks Ct
- 6897 Fairside Place NW
- 6849 Fairside Place NW
- 1285 NW Fox Run
- 1576 NW Red Oaks Ct
- 1581 NW Red Oaks Ct
- 6833 Fairside Place NW
- 1301 NW Fox Run
- 1269 NW Fox Run
- 1565 NW Red Oaks Ct
- 6890 Fairside Place NW
- 6817 Fairside Place NW
- 1590 NW Red Oaks Ct
- 6856 Fairside Place NW
- 1317 NW Fox Run
- 1564 NW Red Oaks Ct