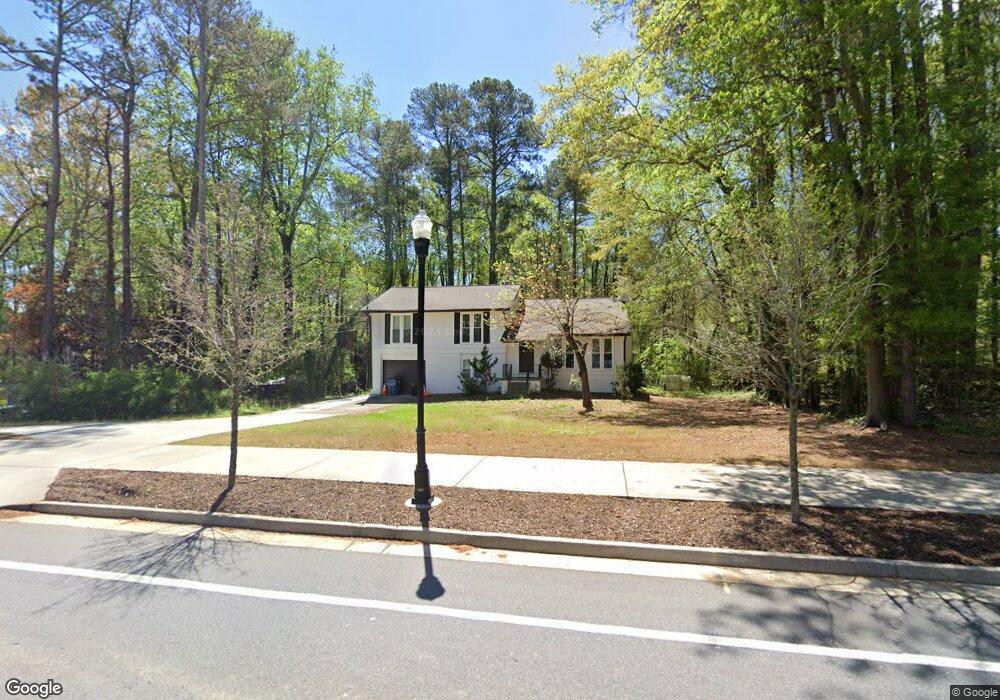
1575 Rucker Rd Alpharetta, GA 30009
Estimated Value: $630,000 - $846,005
4
Beds
3
Baths
1,350
Sq Ft
$529/Sq Ft
Est. Value
About This Home
This home is located at 1575 Rucker Rd, Alpharetta, GA 30009 and is currently estimated at $714,001, approximately $528 per square foot. 1575 Rucker Rd is a home located in Fulton County with nearby schools including Hembree Springs Elementary School, Northwestern Middle School, and Milton High School.
Ownership History
Date
Name
Owned For
Owner Type
Purchase Details
Closed on
Jun 26, 2024
Sold by
Rise Up Drones Llc
Bought by
Apx Consulting Llc
Current Estimated Value
Home Financials for this Owner
Home Financials are based on the most recent Mortgage that was taken out on this home.
Original Mortgage
$576,000
Outstanding Balance
$569,173
Interest Rate
7.03%
Mortgage Type
New Conventional
Estimated Equity
$144,828
Purchase Details
Closed on
Jun 27, 2023
Sold by
Waters Carey L
Bought by
Rise Up Drones Llc
Home Financials for this Owner
Home Financials are based on the most recent Mortgage that was taken out on this home.
Original Mortgage
$567,600
Interest Rate
6.79%
Mortgage Type
Mortgage Modification
Purchase Details
Closed on
Jun 12, 1997
Sold by
Michelfelder Kathy Cheek
Bought by
Waters Carey L and Waters Julie D
Home Financials for this Owner
Home Financials are based on the most recent Mortgage that was taken out on this home.
Original Mortgage
$83,500
Interest Rate
7.93%
Mortgage Type
New Conventional
Create a Home Valuation Report for This Property
The Home Valuation Report is an in-depth analysis detailing your home's value as well as a comparison with similar homes in the area
Home Values in the Area
Average Home Value in this Area
Purchase History
| Date | Buyer | Sale Price | Title Company |
|---|---|---|---|
| Apx Consulting Llc | -- | -- | |
| Rise Up Drones Llc | $640,000 | -- | |
| Waters Carey L | $42,800 | -- |
Source: Public Records
Mortgage History
| Date | Status | Borrower | Loan Amount |
|---|---|---|---|
| Open | Apx Consulting Llc | $576,000 | |
| Previous Owner | Rise Up Drones Llc | $567,600 | |
| Previous Owner | Waters Carey L | $83,500 |
Source: Public Records
Tax History Compared to Growth
Tax History
| Year | Tax Paid | Tax Assessment Tax Assessment Total Assessment is a certain percentage of the fair market value that is determined by local assessors to be the total taxable value of land and additions on the property. | Land | Improvement |
|---|---|---|---|---|
| 2025 | $883 | $180,600 | $83,800 | $96,800 |
| 2023 | $5,098 | $180,600 | $83,800 | $96,800 |
| 2022 | $3,105 | $118,000 | $37,360 | $80,640 |
| 2021 | $3,564 | $108,400 | $31,960 | $76,440 |
| 2020 | $3,462 | $103,200 | $30,440 | $72,760 |
| 2019 | $643 | $111,760 | $29,200 | $82,560 |
| 2018 | $1,669 | $102,920 | $39,360 | $63,560 |
| 2017 | $1,725 | $59,120 | $17,600 | $41,520 |
| 2016 | $1,725 | $59,120 | $17,600 | $41,520 |
| 2015 | $2,072 | $59,120 | $17,600 | $41,520 |
| 2014 | $1,812 | $59,120 | $17,600 | $41,520 |
Source: Public Records
Map
Nearby Homes
- 1614 Rucker Rd
- 1530 Rucker Rd
- 1413 Bellsmith Dr
- 116 Emily Ln
- 1386 Bellsmith Dr
- Hillstone with Basement Plan at Emberly - Monarch Collection
- Rockmart Elite Plan at Emberly - Mariposa Collection
- Rockmart Plan at Emberly - Mariposa Collection
- Hedgewood with Basement Plan at Emberly - Monarch Collection
- Hedgewood Plan at Emberly - Monarch Collection
- Hillstone Plan at Emberly - Monarch Collection
- Rockmart Grand Plan at Emberly - Mariposa Collection
- Antoinette with Basement Plan at Emberly - Monarch Collection
- Antoinette Plan at Emberly - Monarch Collection
- 531 S Main St Unit 210
- 531 S Main St Unit 320
- 531 S Main St Unit 330
- 531 S Main St Unit 410
- 3052 Steeplechase
- 3058 Steeplechase Unit 4
- 1585 Rucker Rd
- 100 Arrowood Ln
- 1595 Rucker Rd Unit 1595
- 1595 Rucker Rd
- 120 Arrowood Ct
- 130 Arrowood Ct
- 1600 Rucker Rd
- 200 Saddle Rd Unit 10
- 200 Saddle Rd
- 1580 Rucker Rd
- 130 Arrowood Ln
- 1610 Rucker Rd
- 1614 Rucker Rd Unit 1614
- 121 Arrowood Ln
- 101 Arrowood Ln
- 211 Saddle Rd Unit 8
- 211 Saddle Rd
- 210 Saddle Rd Unit 11
- 210 Saddle Rd
- 210 Saddle Rd