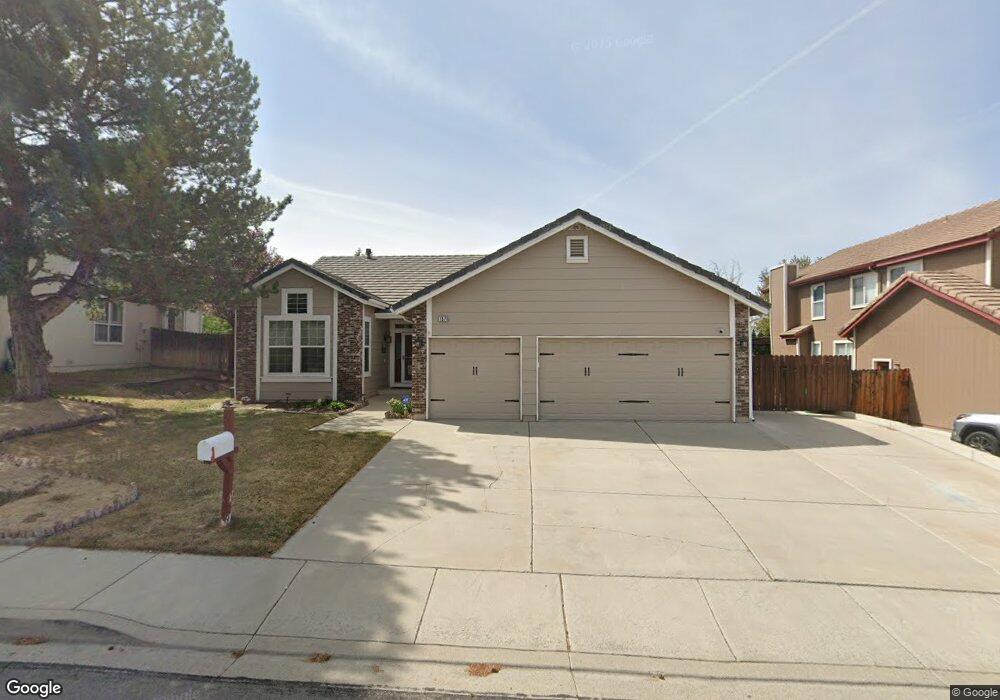
1575 Southview Dr Sparks, NV 89436
Los Altos Parkway NeighborhoodEstimated Value: $588,000 - $610,000
4
Beds
2
Baths
1,983
Sq Ft
$302/Sq Ft
Est. Value
About This Home
This home is located at 1575 Southview Dr, Sparks, NV 89436 and is currently estimated at $599,458, approximately $302 per square foot. 1575 Southview Dr is a home located in Washoe County with nearby schools including Bud Beasley Elementary School, Lou Mendive Middle School, and Edward C Reed High School.
Ownership History
Date
Name
Owned For
Owner Type
Purchase Details
Closed on
Aug 24, 2010
Sold by
Hallahan Susan D
Bought by
Hallahan Susan D and Susan D Hallahan 2005 Trust
Current Estimated Value
Home Financials for this Owner
Home Financials are based on the most recent Mortgage that was taken out on this home.
Original Mortgage
$177,700
Interest Rate
4.52%
Mortgage Type
New Conventional
Purchase Details
Closed on
Apr 15, 2005
Sold by
Hallahan Susan D
Bought by
Hallahan Susan D and The Susan D Hallahan 2005 Trust
Purchase Details
Closed on
Apr 7, 2003
Sold by
Hallahan John M
Bought by
Hallahan Susan D
Home Financials for this Owner
Home Financials are based on the most recent Mortgage that was taken out on this home.
Original Mortgage
$207,000
Interest Rate
5.73%
Purchase Details
Closed on
Oct 15, 1996
Sold by
Akers John T and Akers Deborah P
Bought by
Hallahan John M and Hallahan Susan D
Home Financials for this Owner
Home Financials are based on the most recent Mortgage that was taken out on this home.
Original Mortgage
$182,400
Interest Rate
8.3%
Create a Home Valuation Report for This Property
The Home Valuation Report is an in-depth analysis detailing your home's value as well as a comparison with similar homes in the area
Home Values in the Area
Average Home Value in this Area
Purchase History
| Date | Buyer | Sale Price | Title Company |
|---|---|---|---|
| Hallahan Susan D | -- | First Centennial Reno | |
| Hallahan Susan D | -- | First Centennial Reno | |
| Hallahan Susan D | -- | -- | |
| Hallahan Susan D | -- | First Centennial Title Co | |
| Hallahan John M | $192,000 | Stewart Title |
Source: Public Records
Mortgage History
| Date | Status | Borrower | Loan Amount |
|---|---|---|---|
| Closed | Hallahan Susan D | $177,700 | |
| Closed | Hallahan Susan D | $207,000 | |
| Closed | Hallahan John M | $182,400 |
Source: Public Records
Tax History
| Year | Tax Paid | Tax Assessment Tax Assessment Total Assessment is a certain percentage of the fair market value that is determined by local assessors to be the total taxable value of land and additions on the property. | Land | Improvement |
|---|---|---|---|---|
| 2026 | $2,635 | $127,529 | $42,560 | $84,969 |
| 2025 | $3,417 | $129,338 | $42,560 | $86,778 |
| 2024 | $3,417 | $128,640 | $40,075 | $88,565 |
| 2023 | $3,319 | $121,651 | $38,710 | $82,941 |
| 2022 | $3,223 | $102,277 | $32,830 | $69,447 |
| 2021 | $3,129 | $93,128 | $23,835 | $69,293 |
| 2020 | $3,036 | $93,785 | $23,800 | $69,985 |
| 2019 | $2,948 | $91,880 | $24,360 | $67,520 |
| 2018 | $2,862 | $83,986 | $17,780 | $66,206 |
| 2017 | $2,779 | $83,076 | $16,450 | $66,626 |
| 2016 | $2,709 | $82,227 | $14,525 | $67,702 |
| 2015 | $2,704 | $79,925 | $12,880 | $67,045 |
| 2014 | $2,627 | $76,108 | $10,885 | $65,223 |
| 2013 | -- | $63,131 | $8,925 | $54,206 |
Source: Public Records
Map
Nearby Homes
- 4800 Frankie Way
- 4896 Treetop Rd
- 5216 Santa Barbara Ave
- 1716 Canyon Terrace Dr
- 1616 Canyon Terrace Dr
- 1388 Lambrays Ln
- 1901 Canyon Ridge Dr
- 1215 Ebling Dr
- 5070 Rhine Wine Dr
- 1472 Giannotti Dr
- 5385 Santa Anita Dr
- 1295 Glendora Ln
- 4995 Wine Cellar Dr
- 4430 Dancing Moon Ct
- 5435 Santa Rosa Ave
- 4455 Desert Highlands Dr
- 1522 Satellite Dr
- 5455 Santa Barbara Ave
- 1080 Cartago Ct
- 1381 Laser Ct
- 1585 Southview Dr
- 1565 Southview Dr
- 1580 Freeman Way
- 4848 Frankie Way
- 1595 Southview Dr
- 1555 Southview Dr
- 1570 Freeman Way
- 4885 Crestside Dr
- 1570 Southview Dr
- 1560 Southview Dr
- 4842 Frankie Way
- 4875 Crestside Dr
- 1545 Southview Dr
- 1550 Southview Dr
- 1550 Freeman Way
- 4836 Frankie Way
- 4865 Crestside Dr
- 1565 Freeman Way
- 1605 Southview Dr
- 4886 Crestside Dr
Your Personal Tour Guide
Ask me questions while you tour the home.