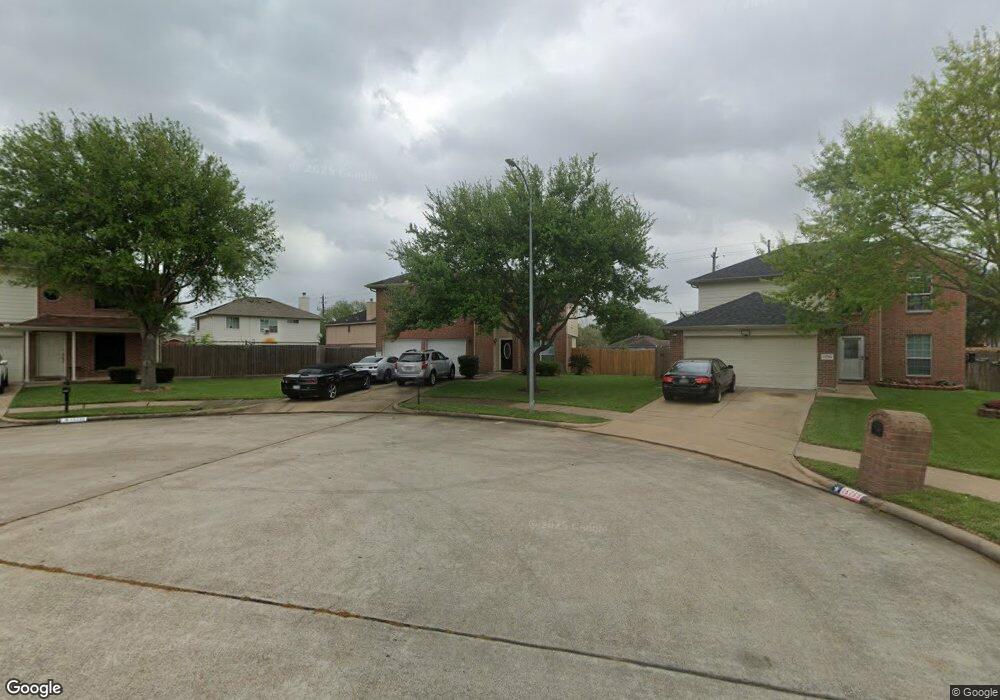
15755 Briargate Ct Missouri City, TX 77489
Fort Bend Houston NeighborhoodEstimated Value: $234,000 - $267,000
4
Beds
2
Baths
2,120
Sq Ft
$117/Sq Ft
Est. Value
About This Home
This home is located at 15755 Briargate Ct, Missouri City, TX 77489 and is currently estimated at $246,995, approximately $116 per square foot. 15755 Briargate Ct is a home located in Fort Bend County with nearby schools including Briargate Elementary School, Blue Ridge Elementary School, and Christa McAuliffe Middle School.
Ownership History
Date
Name
Owned For
Owner Type
Purchase Details
Closed on
Nov 10, 2020
Sold by
Tricon Sfr 2020 2 Borrower Llc
Bought by
Tricon Sfr 2020 2 Borrower Llc
Current Estimated Value
Purchase Details
Closed on
Oct 25, 2016
Sold by
Tah Holdings Lp
Bought by
Tah 2016-1 Borrower Llc
Purchase Details
Closed on
Apr 16, 2015
Sold by
Bltrejv3 Houston Llc
Bought by
Tah 2016-1 Borrower Llc
Purchase Details
Closed on
Oct 1, 2013
Sold by
Brown Alvin and Brown Jamesetta
Bought by
Bltrejv3 Houston Llc
Purchase Details
Closed on
Mar 14, 2008
Sold by
Brown Alvin
Bought by
Randle Brown Jamesetta
Purchase Details
Closed on
Apr 2, 2003
Sold by
Gateway Homes Ltd
Bought by
Brown Alvin
Home Financials for this Owner
Home Financials are based on the most recent Mortgage that was taken out on this home.
Original Mortgage
$129,476
Interest Rate
5.77%
Mortgage Type
FHA
Create a Home Valuation Report for This Property
The Home Valuation Report is an in-depth analysis detailing your home's value as well as a comparison with similar homes in the area
Home Values in the Area
Average Home Value in this Area
Purchase History
| Date | Buyer | Sale Price | Title Company |
|---|---|---|---|
| Tricon Sfr 2020 2 Borrower Llc | -- | Os National Llc | |
| Tah 2016-1 Borrower Llc | -- | -- | |
| Tah 2016-1 Borrower Llc | -- | -- | |
| Bltrejv3 Houston Llc | $91,000 | None Available | |
| Tah 2016-1 Borrower Llc | -- | -- | |
| Randle Brown Jamesetta | -- | None Available | |
| Brown Alvin | -- | Houston Title Co |
Source: Public Records
Mortgage History
| Date | Status | Borrower | Loan Amount |
|---|---|---|---|
| Previous Owner | Brown Alvin | $129,476 |
Source: Public Records
Tax History Compared to Growth
Tax History
| Year | Tax Paid | Tax Assessment Tax Assessment Total Assessment is a certain percentage of the fair market value that is determined by local assessors to be the total taxable value of land and additions on the property. | Land | Improvement |
|---|---|---|---|---|
| 2025 | $4,548 | $275,473 | $79,235 | $196,238 |
| 2024 | $4,548 | $235,874 | $79,235 | $156,639 |
| 2023 | $4,548 | $234,325 | $60,950 | $173,375 |
| 2022 | $4,234 | $199,790 | $44,850 | $154,940 |
| 2021 | $3,905 | $176,380 | $30,480 | $145,900 |
| 2020 | $3,854 | $170,890 | $30,480 | $140,410 |
| 2019 | $3,290 | $138,680 | $30,480 | $108,200 |
| 2018 | $3,205 | $135,050 | $24,730 | $110,320 |
| 2017 | $3,329 | $138,680 | $24,730 | $113,950 |
| 2016 | $2,987 | $124,420 | $24,730 | $99,690 |
| 2015 | $2,162 | $118,400 | $24,730 | $93,670 |
| 2014 | $1,667 | $90,870 | $24,730 | $66,140 |
Source: Public Records
Map
Nearby Homes
- 15734 Briargate Ct
- 15806 Corsair Rd
- 15770 Chimney Rock Rd
- 15610 Briar Spring Ct
- 15823 Kueben Ln
- 15615 Raven Trail
- 16210 Rosenridge Dr
- 15950 Chimney Rock Rd
- 16202 Bowridge Ln
- 6407 Rambleridge Dr
- 5710 W Ridgecreek Dr
- 6618 Trigate Dr
- 6623 Maczali Dr
- 6018 Beaconridge Dr
- 5774 Gineridge Dr
- 6101 Maywood Dr
- 6618 Castleview Ln
- 6610 Rockergate Dr
- 15318 Corsair Rd
- 5614 Condon Ln
- 15759 Briargate Ct
- 15751 Briargate Ct
- 6319 W Ridgecreek Dr
- 6315 W Ridgecreek Dr
- 6323 W Ridgecreek Dr
- 6323 W Ridgecreek Dr
- 15747 Briargate Ct
- 6502 Banta Dr
- 6506 Banta Dr
- 15743 Briargate Ct
- 6331 W Ridgecreek Dr
- 6510 Banta Dr
- 15738 Briargate Ct
- 15739 Briargate Ct
- 6335 W Ridgecreek Dr
- 15906 Corsair Rd
- 15910 Corsair Rd
- 6310 W Ridgecreek Dr
- 15902 Corsair Rd
- 6514 Banta Dr