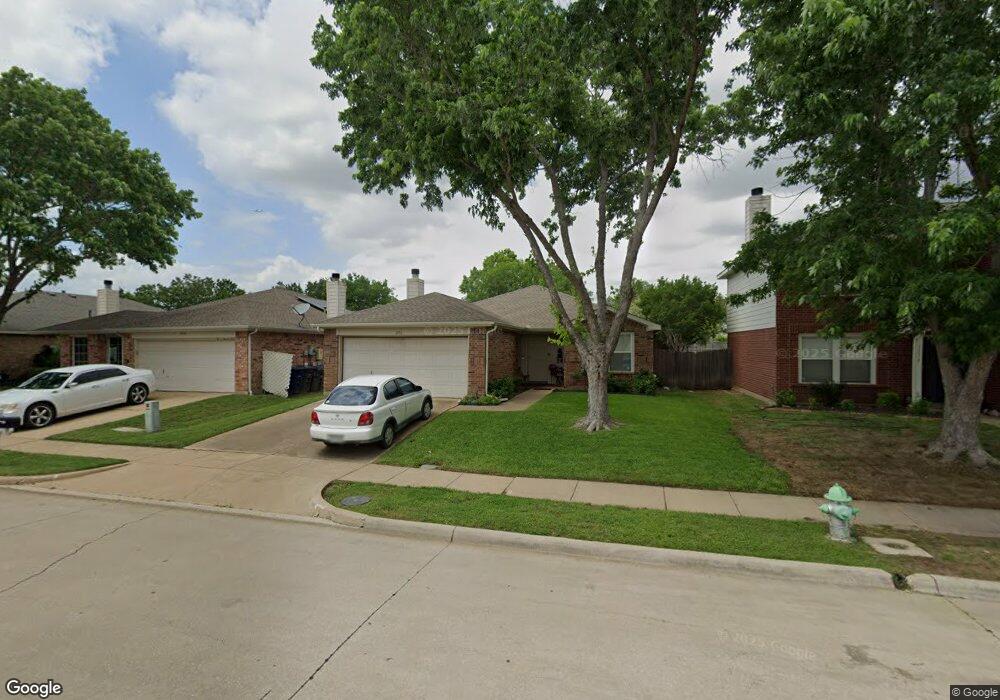
1576 Chivalry Ln Little Elm, TX 75068
Estimated Value: $298,000 - $318,000
3
Beds
2
Baths
1,251
Sq Ft
$245/Sq Ft
Est. Value
About This Home
This home is located at 1576 Chivalry Ln, Little Elm, TX 75068 and is currently estimated at $305,900, approximately $244 per square foot. 1576 Chivalry Ln is a home located in Denton County with nearby schools including Brent Elementary School, Jerry R. Walker Middle School, and Little Elm High School.
Ownership History
Date
Name
Owned For
Owner Type
Purchase Details
Closed on
Nov 26, 2019
Sold by
Ogaard Joann
Bought by
Steinbach Audrey
Current Estimated Value
Purchase Details
Closed on
Jan 4, 2017
Sold by
Ogaard Joann
Bought by
Steinbach Audrey and Ogaard Knut
Purchase Details
Closed on
Jul 31, 2008
Sold by
Downes Harold M and Downes Mary B
Bought by
Ogaard Joann
Home Financials for this Owner
Home Financials are based on the most recent Mortgage that was taken out on this home.
Original Mortgage
$105,450
Interest Rate
6.4%
Mortgage Type
Purchase Money Mortgage
Purchase Details
Closed on
Aug 17, 2000
Sold by
Rh Of Texas Ltd Partnership
Bought by
Downes Harold M and Downes Mary B
Home Financials for this Owner
Home Financials are based on the most recent Mortgage that was taken out on this home.
Original Mortgage
$72,650
Interest Rate
7.9%
Create a Home Valuation Report for This Property
The Home Valuation Report is an in-depth analysis detailing your home's value as well as a comparison with similar homes in the area
Home Values in the Area
Average Home Value in this Area
Purchase History
| Date | Buyer | Sale Price | Title Company |
|---|---|---|---|
| Steinbach Audrey | -- | None Available | |
| Steinbach Audrey | -- | None Available | |
| Ogaard Joann | -- | None Available | |
| Downes Harold M | -- | -- |
Source: Public Records
Mortgage History
| Date | Status | Borrower | Loan Amount |
|---|---|---|---|
| Previous Owner | Ogaard Joann | $105,450 | |
| Previous Owner | Downes Harold M | $72,650 |
Source: Public Records
Tax History Compared to Growth
Tax History
| Year | Tax Paid | Tax Assessment Tax Assessment Total Assessment is a certain percentage of the fair market value that is determined by local assessors to be the total taxable value of land and additions on the property. | Land | Improvement |
|---|---|---|---|---|
| 2025 | $877 | $273,965 | $66,000 | $215,852 |
| 2024 | $4,914 | $249,059 | $0 | $0 |
| 2023 | $877 | $226,417 | $66,000 | $218,357 |
| 2022 | $4,653 | $205,834 | $66,000 | $171,650 |
| 2021 | $4,432 | $187,122 | $44,100 | $143,022 |
| 2020 | $4,207 | $174,328 | $44,100 | $130,228 |
| 2019 | $4,388 | $174,429 | $44,100 | $130,329 |
| 2018 | $4,234 | $173,861 | $44,100 | $141,030 |
| 2017 | $3,873 | $158,055 | $44,100 | $123,196 |
| 2016 | $3,520 | $143,686 | $29,460 | $115,545 |
| 2015 | $2,027 | $130,624 | $29,460 | $102,587 |
| 2013 | -- | $110,400 | $29,460 | $80,940 |
Source: Public Records
Map
Nearby Homes
- 1580 Chivalry Ln
- 3520 Chivalry Ln
- 0 E Eldorado Pkwy
- 1559 Crown View Dr
- 1448 Ridgecrest Dr
- 1409 Ridgecrest Dr
- 1416 Laurel Hall Ln
- 1898 Barton Springs Dr
- 1609 Birch Bend Way
- 1603 Myrtle Dr
- 269 Woodgrove Dr
- 1860 Barton Springs Dr
- 430 Woodgrove Dr Unit A&B
- 1135 E Eldorado Pkwy
- 268 Castleridge Dr
- 338 Castleridge Dr
- 154 Castleridge Dr Unit B
- 318 Castleridge Dr
- 288 Castleridge Dr
- 1900 Clear Creek Dr
- 1574 Chivalry Ln
- 1578 Chivalry Ln
- 1572 Chivalry Ln
- 1575 Crown View Dr
- 1577 Crown View Dr
- 1573 Crown View Dr
- 1570 Chivalry Ln
- 1582 Chivalry Ln
- 1579 Crown View Dr
- 1571 Crown View Dr
- 1575 Chivalry Ln
- 1573 Chivalry Ln
- 1577 Chivalry Ln
- 1569 Crown View Dr
- 1581 Crown View Dr
- 1571 Chivalry Ln
- 1568 Chivalry Ln
- 1579 Chivalry Ln
- 1584 Chivalry Ln
- 1569 Chivalry Ln