Estimated Value: $307,274 - $411,000
4
Beds
2
Baths
2,100
Sq Ft
$170/Sq Ft
Est. Value
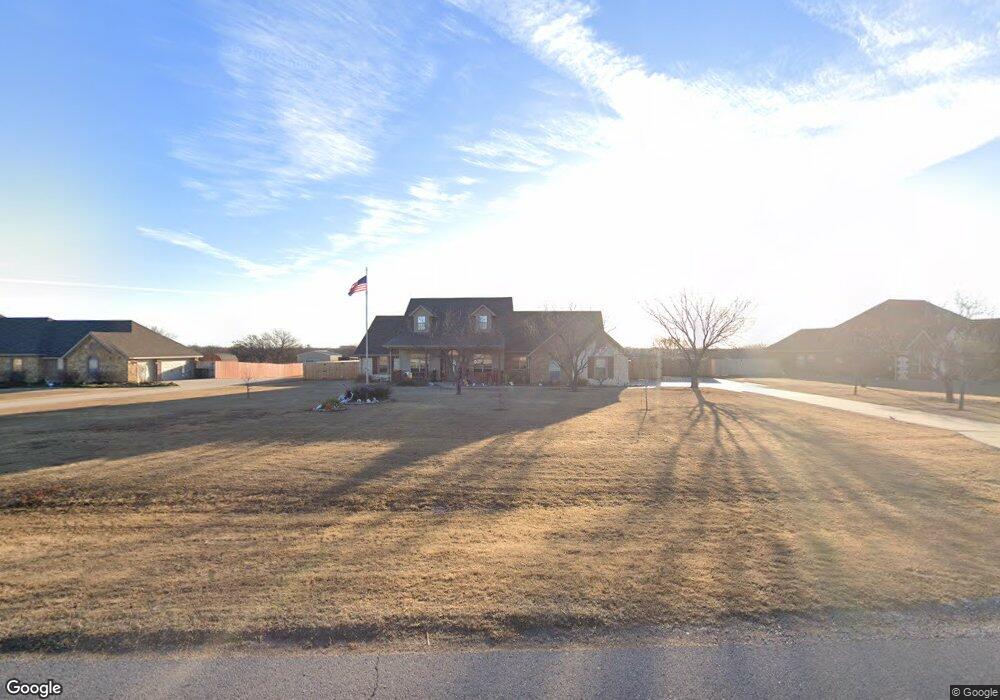
About This Home
This home is located at 1576 SW Paint Rd, Cache, OK 73527 and is currently estimated at $357,319, approximately $170 per square foot. 1576 SW Paint Rd is a home located in Comanche County with nearby schools including Cache Primary Elementary School, Cache Intermediate Elementary School, and Cache Middle School.
Ownership History
Date
Name
Owned For
Owner Type
Purchase Details
Closed on
Mar 16, 2022
Sold by
Chitwood John R and Chitwood Louise Leabeth
Bought by
Chitwood John R and Chitwood Leabeth Louise
Current Estimated Value
Purchase Details
Closed on
Jun 20, 2011
Sold by
Findlay Michael A and Findlay Kathleen E
Bought by
Chitwood John R
Home Financials for this Owner
Home Financials are based on the most recent Mortgage that was taken out on this home.
Original Mortgage
$202,000
Interest Rate
4.74%
Mortgage Type
VA
Purchase Details
Closed on
Jun 20, 2007
Sold by
Morningstar Construction Co Llc
Bought by
Findlay Michael A and Findlay Kathleen E
Home Financials for this Owner
Home Financials are based on the most recent Mortgage that was taken out on this home.
Original Mortgage
$169,520
Interest Rate
6.25%
Mortgage Type
Adjustable Rate Mortgage/ARM
Create a Home Valuation Report for This Property
The Home Valuation Report is an in-depth analysis detailing your home's value as well as a comparison with similar homes in the area
Purchase History
| Date | Buyer | Sale Price | Title Company |
|---|---|---|---|
| Chitwood John R | -- | None Listed On Document | |
| Chitwood John R | $222,000 | -- | |
| Findlay Michael A | $212,000 | -- |
Source: Public Records
Mortgage History
| Date | Status | Borrower | Loan Amount |
|---|---|---|---|
| Previous Owner | Chitwood John R | $202,000 | |
| Previous Owner | Findlay Michael A | $169,520 |
Source: Public Records
Tax History
| Year | Tax Paid | Tax Assessment Tax Assessment Total Assessment is a certain percentage of the fair market value that is determined by local assessors to be the total taxable value of land and additions on the property. | Land | Improvement |
|---|---|---|---|---|
| 2025 | $3,084 | $30,472 | $4,275 | $26,197 |
| 2024 | $3,084 | $29,584 | $4,275 | $25,309 |
| 2023 | $3,084 | $28,993 | $2,925 | $26,068 |
| 2022 | $3,254 | $29,923 | $2,851 | $27,072 |
| 2021 | $2,614 | $29,051 | $2,839 | $26,212 |
| 2020 | $2,758 | $28,205 | $2,757 | $25,448 |
| 2019 | $2,691 | $27,384 | $2,693 | $24,691 |
| 2018 | $2,640 | $26,586 | $2,631 | $23,955 |
| 2017 | $2,478 | $25,812 | $2,579 | $23,233 |
| 2016 | $2,362 | $25,060 | $2,531 | $22,529 |
| 2015 | $2,357 | $25,060 | $2,531 | $22,529 |
| 2014 | $2,422 | $25,060 | $2,531 | $22,529 |
Source: Public Records
Map
Nearby Homes
- 357 SW Matthey Dr
- 147 SW Elk Creek Loop
- 168 SW Crater Creek Rd
- 621 SW Eden Place
- 7020 SW Deyo Mission Rd
- 17168 W Gore Blvd
- 817 Hummingbird Dr
- 207 & 1/2 N Crater Creek Rd
- 33 NW Heatherstone Dr
- 209 E B Ave
- 114 NW Sandy Trail Cir
- 703 SW 6th
- 207 C Ave
- 405 N Mountain Meadow Dr
- 12 NW Valley Ridge Dr
- 433 NE Creekside Dr
- 11 NW Forest Place
- 414 NW Granite Ave
- 111 S 6th St
- 112 NW Elm Ave
- 1548 SW Paint Rd
- 1604 SW Paint Rd
- 1632 SW Paint Rd
- 1520 SW Paint Rd
- 1658 SW Paint Rd
- 1462 SW Paint Rd
- 1696 SW Paint Rd
- 1434 SW Paint Rd
- 1732 SW Paint Rd
- 1408 SW Paint Rd
- 1760 SW Paint Rd
- 1380 SW Paint Rd
- 1784 SW Paint Rd
- 1352 SW Paint Rd
- 1792 SW Paint Rd
- 1322 SW Paint Rd
- 1741 SW Chinook Ln
- 1763 SW Chinook Ln
- 1755 SW Chinook Ln
- 1798 SW Paint Rd
Your Personal Tour Guide
Ask me questions while you tour the home.