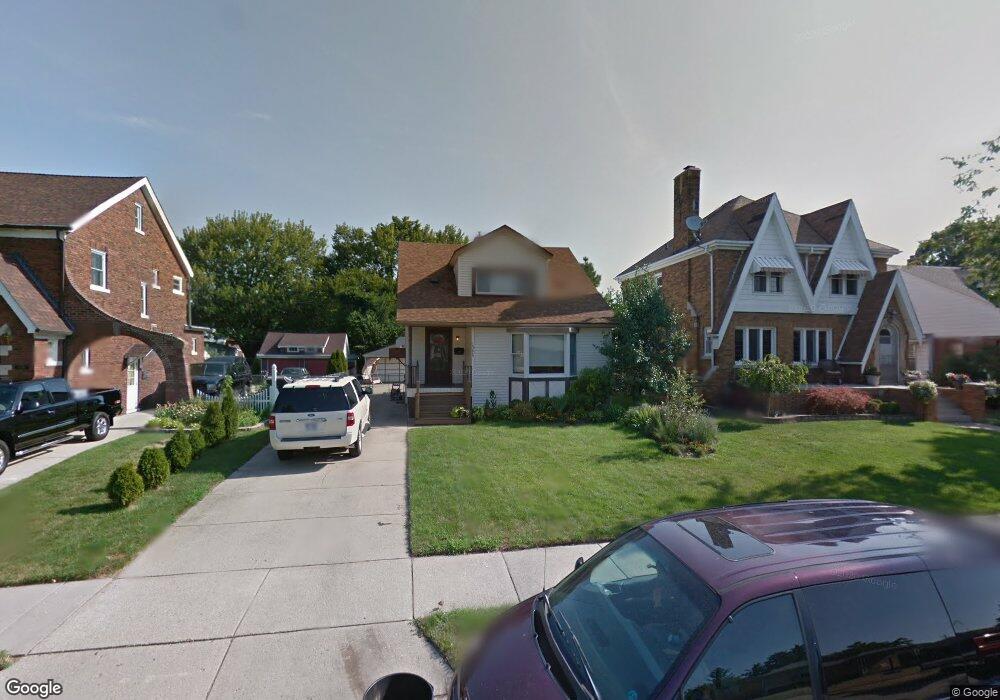
15765 Charles R Ave Eastpointe, MI 48021
Estimated Value: $204,000 - $230,000
3
Beds
2
Baths
1,752
Sq Ft
$122/Sq Ft
Est. Value
About This Home
This home is located at 15765 Charles R Ave, Eastpointe, MI 48021 and is currently estimated at $213,978, approximately $122 per square foot. 15765 Charles R Ave is a home located in Macomb County with nearby schools including Bellview Elementary School, Eastpointe Middle School, and Macomb Montessori Academy.
Ownership History
Date
Name
Owned For
Owner Type
Purchase Details
Closed on
Jul 1, 2011
Sold by
Kremnetz Dale M and Kremnetz Sengul
Bought by
Kremnetz Dale M
Current Estimated Value
Home Financials for this Owner
Home Financials are based on the most recent Mortgage that was taken out on this home.
Original Mortgage
$167,047
Outstanding Balance
$106,415
Interest Rate
3%
Mortgage Type
VA
Estimated Equity
$107,563
Purchase Details
Closed on
Aug 31, 2005
Sold by
Fisher Richard C and Fisher Ann E
Bought by
Kremnetz Dale M
Home Financials for this Owner
Home Financials are based on the most recent Mortgage that was taken out on this home.
Original Mortgage
$168,960
Interest Rate
5.93%
Mortgage Type
VA
Purchase Details
Closed on
Nov 5, 1999
Sold by
Wagner Gerald T
Bought by
Fisher Richard C
Create a Home Valuation Report for This Property
The Home Valuation Report is an in-depth analysis detailing your home's value as well as a comparison with similar homes in the area
Home Values in the Area
Average Home Value in this Area
Purchase History
| Date | Buyer | Sale Price | Title Company |
|---|---|---|---|
| Kremnetz Dale M | -- | National Title Network Inc | |
| Kremnetz Dale M | $165,000 | Great Lakes Title Of Mi | |
| Fisher Richard C | $126,000 | -- |
Source: Public Records
Mortgage History
| Date | Status | Borrower | Loan Amount |
|---|---|---|---|
| Open | Kremnetz Dale M | $167,047 | |
| Closed | Kremnetz Dale M | $168,960 |
Source: Public Records
Tax History Compared to Growth
Tax History
| Year | Tax Paid | Tax Assessment Tax Assessment Total Assessment is a certain percentage of the fair market value that is determined by local assessors to be the total taxable value of land and additions on the property. | Land | Improvement |
|---|---|---|---|---|
| 2025 | $2,382 | $101,600 | $0 | $0 |
| 2024 | $2,247 | $99,700 | $0 | $0 |
| 2023 | $2,176 | $92,400 | $0 | $0 |
| 2022 | $2,252 | $83,300 | $0 | $0 |
| 2021 | $2,218 | $65,200 | $0 | $0 |
| 2020 | $2,118 | $57,400 | $0 | $0 |
| 2019 | $2,123 | $44,600 | $0 | $0 |
| 2018 | $2,631 | $36,240 | $0 | $0 |
| 2017 | $2,420 | $34,610 | $3,650 | $30,960 |
| 2016 | $2,055 | $34,610 | $0 | $0 |
| 2015 | $1,447 | $31,100 | $0 | $0 |
| 2013 | $1,625 | $30,160 | $0 | $0 |
Source: Public Records
Map
Nearby Homes
- 15560 Charles R Ave
- 15723 Deerfield Ave
- 15337 Charles R Ave
- 15593 Evergreen Ave
- 16137 Evergreen Ave
- 15105 Charles R Ave
- 15219 E 9 Mile Rd Unit 3A
- 15604 Nicolai Ave
- 15852 Semrau Ave
- 15420 Couzens Ave
- 15655 Semrau Ave
- 15305 Evergreen Ave
- 16241 Evergreen Ave
- 22173 Nevada Ave
- 15315 Semrau Ave
- 23013 Melrose Ave
- 22131 Nevada Ave
- 15033 Camden Ave
- 22099 Nevada Ave
- 23009 Hayes Ave
- 15755 Charles R Ave
- 15775 Charles R Ave
- 15785 Charles R Ave
- 15774 Camden Ave
- 15754 Camden Ave
- 15751 Charles R Ave
- 15764 Camden Ave
- 15744 Camden Ave
- 15795 Charles R Ave
- 15734 Camden Ave
- 15723 Charles R Ave
- 15784 Camden Ave
- 15774 Charles R Ave
- 15754 Charles R Ave
- 15794 Camden Ave
- 15744 Charles R Ave
- 15724 Camden Ave
- 15784 Charles R Ave
- 15807 Charles R Ave
- 15794 Charles R Ave