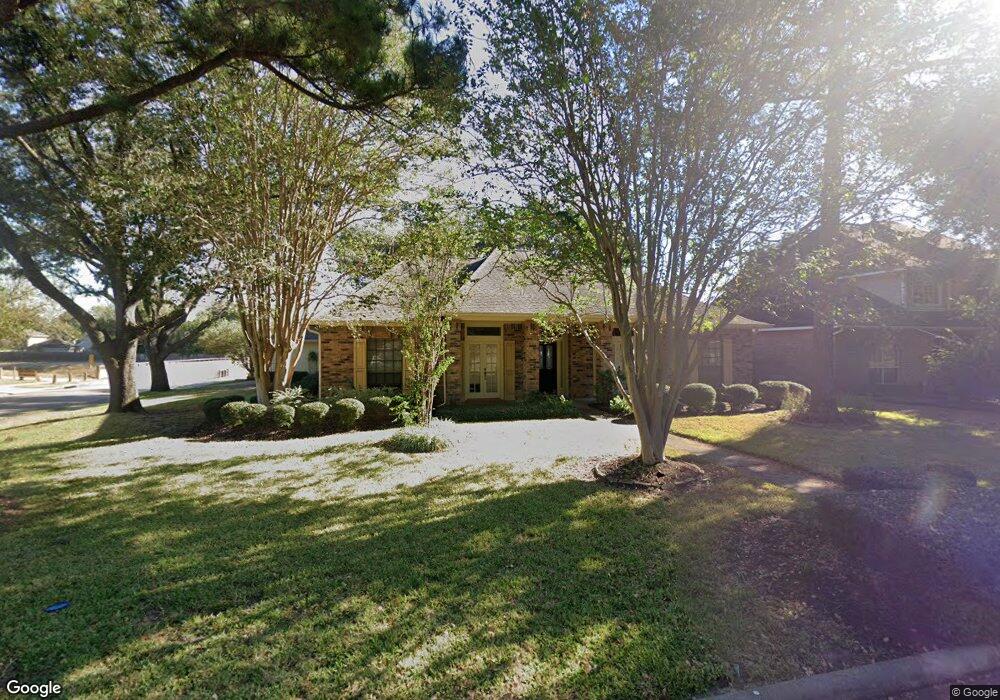
15766 Sweetwater Creek Dr Houston, TX 77095
Copperfield NeighborhoodEstimated Value: $333,000 - $359,000
4
Beds
3
Baths
2,421
Sq Ft
$142/Sq Ft
Est. Value
About This Home
This home is located at 15766 Sweetwater Creek Dr, Houston, TX 77095 and is currently estimated at $344,824, approximately $142 per square foot. 15766 Sweetwater Creek Dr is a home located in Harris County with nearby schools including Lowery Elementary School, Aragon Middle School, and Langham Creek High School.
Ownership History
Date
Name
Owned For
Owner Type
Purchase Details
Closed on
Sep 30, 2005
Sold by
Johnson Christopher C and Johnson Diana
Bought by
Macomber Michael D and Macomber Sherril L
Current Estimated Value
Home Financials for this Owner
Home Financials are based on the most recent Mortgage that was taken out on this home.
Original Mortgage
$127,200
Outstanding Balance
$67,955
Interest Rate
5.73%
Mortgage Type
Fannie Mae Freddie Mac
Estimated Equity
$276,869
Purchase Details
Closed on
Jul 13, 2000
Sold by
Hudson David L and Hudson Kathy A
Bought by
Johnson Christopher C
Home Financials for this Owner
Home Financials are based on the most recent Mortgage that was taken out on this home.
Original Mortgage
$145,450
Interest Rate
8.36%
Create a Home Valuation Report for This Property
The Home Valuation Report is an in-depth analysis detailing your home's value as well as a comparison with similar homes in the area
Home Values in the Area
Average Home Value in this Area
Purchase History
| Date | Buyer | Sale Price | Title Company |
|---|---|---|---|
| Macomber Michael D | -- | American Title Co | |
| Johnson Christopher C | -- | -- |
Source: Public Records
Mortgage History
| Date | Status | Borrower | Loan Amount |
|---|---|---|---|
| Open | Macomber Michael D | $127,200 | |
| Previous Owner | Johnson Christopher C | $145,450 |
Source: Public Records
Tax History Compared to Growth
Tax History
| Year | Tax Paid | Tax Assessment Tax Assessment Total Assessment is a certain percentage of the fair market value that is determined by local assessors to be the total taxable value of land and additions on the property. | Land | Improvement |
|---|---|---|---|---|
| 2025 | $1,094 | $316,091 | $83,539 | $232,552 |
| 2024 | $1,094 | $320,278 | $69,541 | $250,737 |
| 2023 | $1,094 | $337,121 | $69,541 | $267,580 |
| 2022 | $6,050 | $298,657 | $49,672 | $248,985 |
| 2021 | $5,795 | $249,596 | $49,672 | $199,924 |
| 2020 | $6,094 | $255,520 | $38,383 | $217,137 |
| 2019 | $5,783 | $235,727 | $35,221 | $200,506 |
| 2018 | $1,734 | $213,023 | $35,221 | $177,802 |
| 2017 | $4,886 | $213,023 | $35,221 | $177,802 |
| 2016 | $4,611 | $201,048 | $35,221 | $165,827 |
| 2015 | $3,397 | $201,048 | $35,221 | $165,827 |
| 2014 | $3,397 | $182,327 | $35,221 | $147,106 |
Source: Public Records
Map
Nearby Homes
- 15854 Knolls Lodge Dr
- 8203 Green Devon Dr
- 15918 Pinyon Creek Dr
- 7731 Club Lake Dr
- 16026 Autumn Falls Ln
- 8211 Riverglade Dr
- 16030 Royal Garden Dr
- 15810 Knoll Lake Dr
- 16114 Kintyre Point Rd
- 8526 Hot Springs Dr
- 15339 Glenwood Park Dr
- 15131 New Hastings Dr
- 15611 Meadow Village Dr
- 16215 Wemyss Bay Rd
- 8306 Lake Crystal Dr
- 16215 Cairngorm Ave
- 14962 Royal Birkdale St
- 7827 Alamar Dr
- 15726 Echo Lodge Dr
- 15954 Oak Mountain Dr
- 15762 Sweetwater Creek Dr
- 15802 Sweetwater Creek Dr
- 15758 Sweetwater Creek Dr
- 7823 Villa Lake Dr
- 15754 Sweetwater Creek Dr
- 15806 Sweetwater Creek Dr
- 7827 Pine Falls Dr
- 7822 Pine Falls Dr
- 7819 Villa Lake Dr
- 15750 Sweetwater Creek Dr
- 15810 Sweetwater Creek Dr
- 7823 Pine Falls Dr
- 7818 Pine Falls Dr
- 7826 Green Devon Dr
- 7822 Villa Lake Dr
- 7815 Villa Lake Dr
- 8002 Pine Falls Dr
- 15746 Sweetwater Creek Dr
- 15814 Sweetwater Creek Dr
- 7819 Pine Falls Dr