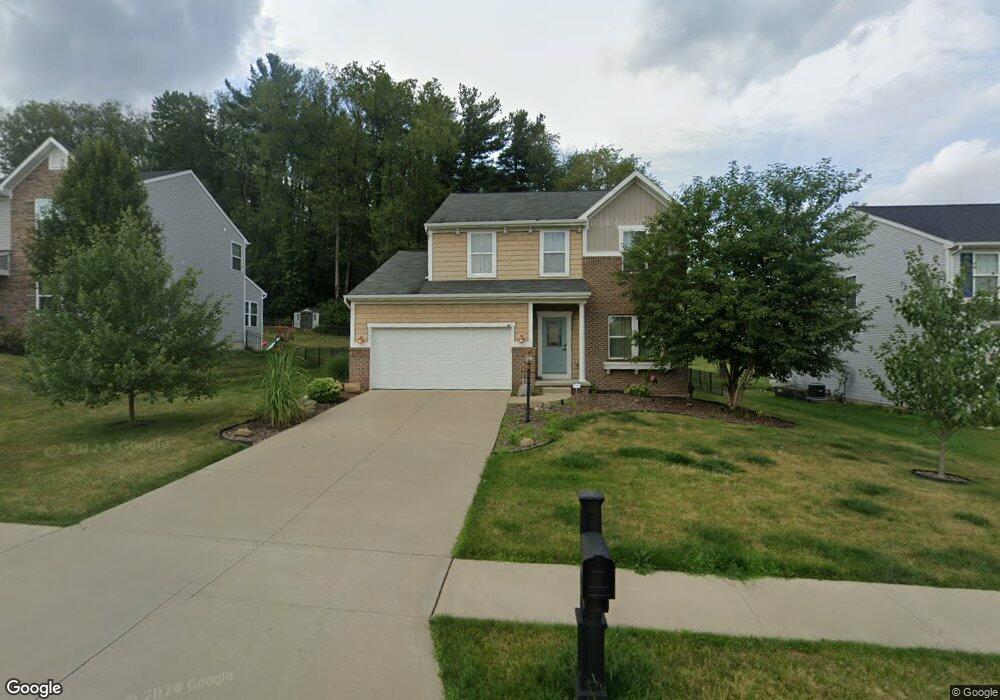
1577 Bellview St NE Canton, OH 44721
Estimated Value: $330,000 - $357,000
3
Beds
3
Baths
2,112
Sq Ft
$165/Sq Ft
Est. Value
About This Home
This home is located at 1577 Bellview St NE, Canton, OH 44721 and is currently estimated at $348,564, approximately $165 per square foot. 1577 Bellview St NE is a home with nearby schools including Middlebranch Elementary School, Oakwood Middle School, and GlenOak High School.
Ownership History
Date
Name
Owned For
Owner Type
Purchase Details
Closed on
Jul 1, 2020
Sold by
Baringer Amie E
Bought by
Baringer Kris A
Current Estimated Value
Purchase Details
Closed on
Oct 19, 2011
Sold by
Nvr Inc
Bought by
Baringer Kris A and Baringer Amie E
Home Financials for this Owner
Home Financials are based on the most recent Mortgage that was taken out on this home.
Original Mortgage
$194,965
Outstanding Balance
$132,460
Interest Rate
4.02%
Mortgage Type
VA
Estimated Equity
$216,104
Purchase Details
Closed on
Aug 28, 2011
Sold by
Wagler Enterprises Llc
Bought by
Nvr Inc and Ryan Homes
Home Financials for this Owner
Home Financials are based on the most recent Mortgage that was taken out on this home.
Original Mortgage
$194,965
Outstanding Balance
$132,460
Interest Rate
4.02%
Mortgage Type
VA
Estimated Equity
$216,104
Purchase Details
Closed on
Dec 21, 2010
Sold by
Wagler Homes Of Akron Inc
Bought by
Wagler Enterprises Llc
Create a Home Valuation Report for This Property
The Home Valuation Report is an in-depth analysis detailing your home's value as well as a comparison with similar homes in the area
Purchase History
| Date | Buyer | Sale Price | Title Company |
|---|---|---|---|
| Baringer Kris A | -- | None Available | |
| Baringer Kris A | $195,000 | Nvr Title Agency Llc | |
| Nvr Inc | $35,000 | None Available | |
| Wagler Enterprises Llc | -- | None Available |
Source: Public Records
Mortgage History
| Date | Status | Borrower | Loan Amount |
|---|---|---|---|
| Open | Baringer Kris A | $194,965 |
Source: Public Records
Tax History
| Year | Tax Paid | Tax Assessment Tax Assessment Total Assessment is a certain percentage of the fair market value that is determined by local assessors to be the total taxable value of land and additions on the property. | Land | Improvement |
|---|---|---|---|---|
| 2025 | -- | $103,880 | $29,890 | $73,990 |
| 2024 | -- | $103,880 | $29,890 | $73,990 |
| 2023 | $2,858 | $78,400 | $23,240 | $55,160 |
| 2022 | $2,888 | $78,400 | $23,240 | $55,160 |
| 2021 | $2,927 | $79,630 | $23,240 | $56,390 |
| 2020 | $3,827 | $74,000 | $21,110 | $52,890 |
| 2019 | $3,798 | $74,000 | $21,110 | $52,890 |
Source: Public Records
Map
Nearby Homes
- 6525 Pine Bluff Ave NE
- 6562 Pine Bluff Ave NE
- 1443 Southbrook Cir NE
- 1407 Mcdowell St NE
- 1524 Eagle Watch St NE
- 7129 Fenwick Ave NE
- 1240 Fountain View St NE
- 7111 Chatfield Ave NE
- 2033 Red Coach Rd NW
- 2229 Schneider St NW
- 7041 Market Ave N
- 2252 Applegrove St NE
- 7416 Woodcrest Ave NE
- 2684 Mcdowell St NE
- 7192 Middlebranch Ave NE
- 2685 Chaucer Dr NE
- 5981 Wiclif St NE
- 6416 Blossomwood Cir NE
- 1208 Marquardt Ave NW
- 1224 Marquardt Ave NW
- 1599 Bellview St NE
- 1545 Bellview St NE
- 1616 Seabiscuit St NE
- 1590 Bellview St NE
- 1576 Bellview St NE
- 1624 Seabiscuit St NE
- 1562 Bellview St NE
- 1636 Seabiscuit Dr NE
- 1636 Seabiscuit St NE
- 1602 Bellview St NE
- 1612 Seabiscuit Dr NE
- 1544 Bellview St NE
- 1530 Bellview St NE
- 1528 Bellview St NE
- 1531 Bellview St NE
- 1626 Bellview St NE
- 1638 Bellview St NE
- 1611 Seabiscuit Dr NE
- 1627 Seabiscuit St NE
- 1613 Seabiscuit St NE
Your Personal Tour Guide
Ask me questions while you tour the home.