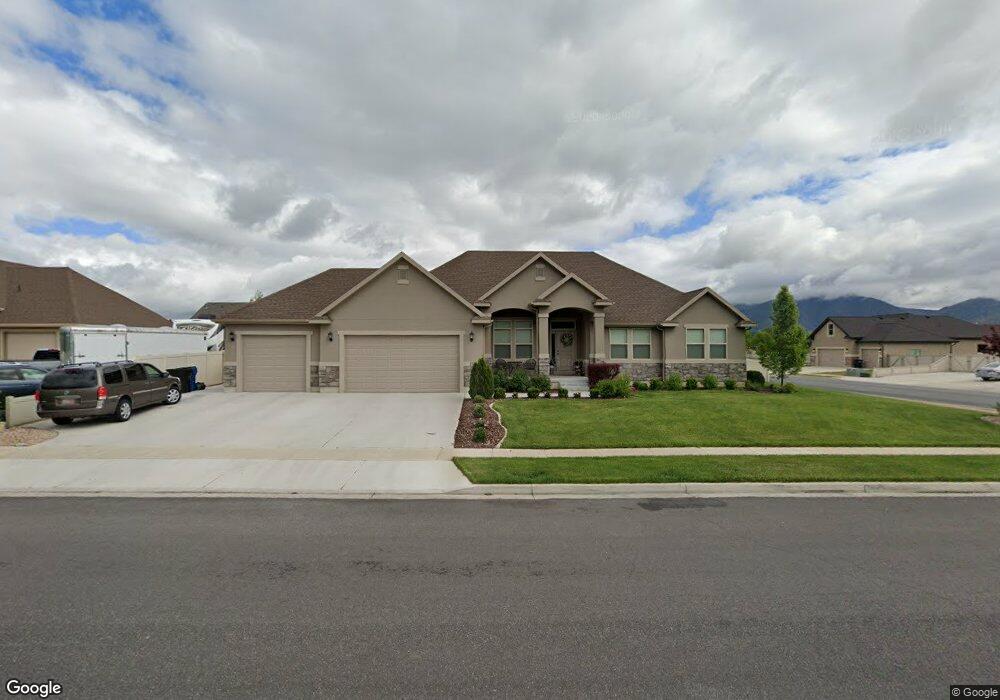
1577 E 130 N Unit 26 Spanish Fork, UT 84660
Estimated Value: $726,000 - $841,000
2
Beds
4
Baths
2,209
Sq Ft
$358/Sq Ft
Est. Value
About This Home
This home is located at 1577 E 130 N Unit 26, Spanish Fork, UT 84660 and is currently estimated at $791,080, approximately $358 per square foot. 1577 E 130 N Unit 26 is a home located in Utah County with nearby schools including Sierra Bonita Elementary School, Diamond Fork Junior High School, and Mapleton Junior High School.
Ownership History
Date
Name
Owned For
Owner Type
Purchase Details
Closed on
Jul 31, 2013
Sold by
Edge Land 14 Llc
Bought by
Tanner Mark W and Tanner Carol S
Current Estimated Value
Home Financials for this Owner
Home Financials are based on the most recent Mortgage that was taken out on this home.
Original Mortgage
$326,800
Outstanding Balance
$238,398
Interest Rate
3.92%
Mortgage Type
New Conventional
Estimated Equity
$552,682
Purchase Details
Closed on
Feb 22, 2013
Sold by
Hulse Rodney Clarence and Hulse Cathryn Jane
Bought by
Edge Land 14 Llc
Purchase Details
Closed on
Nov 30, 2006
Sold by
Hulse Rodney C and Hulse Cathy J
Bought by
Hulse Rodney Clarence and Hulse Cathryn Jane
Create a Home Valuation Report for This Property
The Home Valuation Report is an in-depth analysis detailing your home's value as well as a comparison with similar homes in the area
Home Values in the Area
Average Home Value in this Area
Purchase History
| Date | Buyer | Sale Price | Title Company |
|---|---|---|---|
| Tanner Mark W | -- | Affiliated First Title | |
| Edge Land 14 Llc | -- | Affilated First Title Compan | |
| Hulse Rodney Clarence | -- | Union Title | |
| Hulse Rodney C | -- | Union Title |
Source: Public Records
Mortgage History
| Date | Status | Borrower | Loan Amount |
|---|---|---|---|
| Open | Tanner Mark W | $326,800 |
Source: Public Records
Tax History Compared to Growth
Tax History
| Year | Tax Paid | Tax Assessment Tax Assessment Total Assessment is a certain percentage of the fair market value that is determined by local assessors to be the total taxable value of land and additions on the property. | Land | Improvement |
|---|---|---|---|---|
| 2025 | $3,521 | $393,360 | $249,200 | $466,000 |
| 2024 | $3,521 | $362,945 | $0 | $0 |
| 2023 | $3,634 | $374,990 | $0 | $0 |
| 2022 | $3,487 | $352,935 | $0 | $0 |
| 2021 | $3,009 | $487,100 | $148,800 | $338,300 |
| 2020 | $2,796 | $440,100 | $135,300 | $304,800 |
| 2019 | $2,512 | $416,000 | $126,700 | $289,300 |
| 2018 | $2,473 | $395,900 | $115,900 | $280,000 |
| 2017 | $2,506 | $215,655 | $0 | $0 |
| 2016 | $2,401 | $203,885 | $0 | $0 |
| 2015 | $2,257 | $189,365 | $0 | $0 |
| 2014 | $2,103 | $177,045 | $0 | $0 |
Source: Public Records
Map
Nearby Homes
- 882 N 1650 E Unit 265
- 858 N 1650 E Unit 266
- 857 N 1650 E Unit 267
- 125 N 1430 E
- 1455 E 100 S
- 1005 E 260 N Unit 20
- 2597 E 360 N Unit 16
- 1495 E 400 N
- 1025 E 360 N Unit 5
- 1001 E 360 N Unit 7
- 1022 E 360 N Unit 27
- 991 E 360 N Unit 8
- 1004 E 360 N Unit 28
- 66 Southgate Loop
- 233 N 1120 E
- 3687 E 1270 S
- 1024 E 260 N Unit 18
- 1006 E 260 N Unit 17
- 998 E 260 N Unit 16
- 992 E 260 N Unit 15
- 1549 E 130 N
- 1578 E 200 N
- 1548 E 200 N
- 144 N 1590 E
- 119 N 1590 E
- 119 N 1590 E Unit SR33D
- 164 N 1590 E
- 1523 E 130 N
- 1604 E 130 N Unit 32
- 122 N 1590 E
- 1522 E 200 N
- 1623 E 130 N Unit 28
- 93 N 1590 E
- 1547 E 200 N
- 1581 E 200 N
- 1626 E 200 N
- 1626 E 200 N Unit SR18D
- 94 N 1590 E
- 1487 E 130 N
- 1624 E 130 N Unit 31