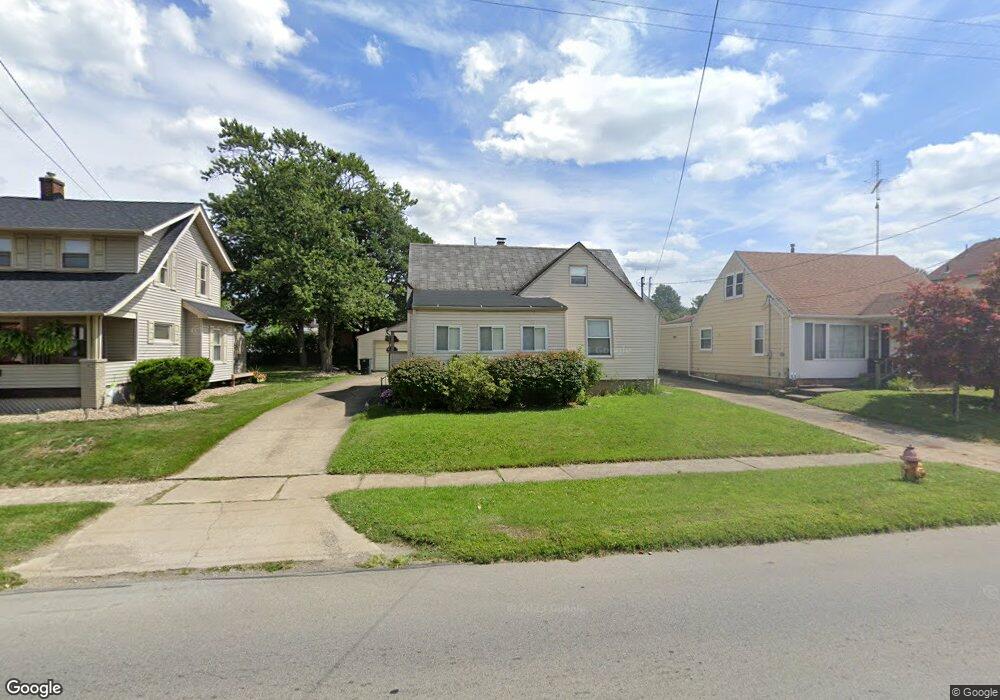
1578 Larchmont Ave NE Warren, OH 44483
Harding NeighborhoodEstimated Value: $59,670 - $105,000
3
Beds
1
Bath
1,032
Sq Ft
$80/Sq Ft
Est. Value
About This Home
This home is located at 1578 Larchmont Ave NE, Warren, OH 44483 and is currently estimated at $82,918, approximately $80 per square foot. 1578 Larchmont Ave NE is a home located in Trumbull County with nearby schools including Warren G. Harding High School, Lincoln PK-8 School, and Steam Academy of Warren.
Ownership History
Date
Name
Owned For
Owner Type
Purchase Details
Closed on
Feb 23, 2006
Sold by
Osborne James
Bought by
Osborne Lisa C
Current Estimated Value
Purchase Details
Closed on
Feb 21, 2006
Sold by
Osborne James
Bought by
Osborne Lisa C
Purchase Details
Closed on
Sep 15, 2004
Sold by
Mancino Mary Ann and Mancino Angelo
Bought by
Osborne James and Osborne Lisa C
Home Financials for this Owner
Home Financials are based on the most recent Mortgage that was taken out on this home.
Original Mortgage
$43,500
Outstanding Balance
$21,838
Interest Rate
6.08%
Mortgage Type
New Conventional
Estimated Equity
$61,080
Purchase Details
Closed on
May 7, 2003
Sold by
Liptak Jennie
Bought by
Liptak Jennie
Purchase Details
Closed on
Jan 1, 1990
Bought by
Steve and Jennie Liptak
Create a Home Valuation Report for This Property
The Home Valuation Report is an in-depth analysis detailing your home's value as well as a comparison with similar homes in the area
Home Values in the Area
Average Home Value in this Area
Purchase History
| Date | Buyer | Sale Price | Title Company |
|---|---|---|---|
| Osborne Lisa C | -- | None Available | |
| Osborne Lisa C | -- | None Available | |
| Osborne James | $58,000 | -- | |
| Liptak Jennie | -- | -- | |
| Steve | -- | -- |
Source: Public Records
Mortgage History
| Date | Status | Borrower | Loan Amount |
|---|---|---|---|
| Open | Liptak Jennie | $43,500 |
Source: Public Records
Tax History Compared to Growth
Tax History
| Year | Tax Paid | Tax Assessment Tax Assessment Total Assessment is a certain percentage of the fair market value that is determined by local assessors to be the total taxable value of land and additions on the property. | Land | Improvement |
|---|---|---|---|---|
| 2024 | $618 | $12,540 | $1,440 | $11,100 |
| 2023 | $618 | $12,540 | $1,440 | $11,100 |
| 2022 | $663 | $10,510 | $1,440 | $9,070 |
| 2021 | $664 | $10,510 | $1,440 | $9,070 |
| 2020 | $665 | $10,510 | $1,440 | $9,070 |
| 2019 | $673 | $10,090 | $1,440 | $8,650 |
| 2018 | $670 | $10,090 | $1,440 | $8,650 |
| 2017 | $660 | $10,090 | $1,440 | $8,650 |
| 2016 | $1,021 | $16,180 | $2,070 | $14,110 |
| 2015 | $1,015 | $16,180 | $2,070 | $14,110 |
| 2014 | $1,009 | $16,180 | $2,070 | $14,110 |
| 2013 | $1,040 | $17,580 | $2,070 | $15,510 |
Source: Public Records
Map
Nearby Homes
- 1630 Bonnie Brae Ave NE
- 1475 Hollywood St NE
- 978 Hollywood St NE
- 1554 Edgewood St NE
- 1815 Atlantic St NE
- 2175 Grissom Dr NE
- 436 Idylwild
- 563 Atlantic St NE
- 1033 Olive Ave NE
- 343 Griswold St NE
- 351 Laird Ave NE
- 424 Kenilworth Ave NE
- 408 Kenilworth Ave NE
- 442 Belmont Ave NE
- 591 Belvedere Ave NE
- 138 Maryland St NE
- 318 Fairmount Ave NE
- 1536 Montclair St NE
- 433 Olive Ave NE Unit 435
- 2545 Woodland St NE
- 1610 Larchmont Ave NE
- 1568 Larchmont Ave NE
- 1620 Larchmont Ave NE
- 1558 Larchmont Ave NE
- 1545 Sheridan Ave NE
- 1553 Sheridan Ave NE
- 1533 Sheridan Ave NE
- 1630 Larchmont Ave NE
- 1548 Larchmont Ave NE
- 1563 Sheridan Ave NE
- 1523 Sheridan Ave NE
- 1605 Larchmont Ave NE
- 1613 Larchmont Ave NE
- 1513 Sheridan Ave NE
- 1638 Larchmont Ave NE
- 1538 Larchmont Ave NE
- 1621 Larchmont Ave NE
- 1557 Larchmont Ave NE
- 1557 Larchmont Ave NE
- 1573 Sheridan Ave NE