Estimated Value: $525,000 - $654,000
3
Beds
3
Baths
2,449
Sq Ft
$239/Sq Ft
Est. Value
About This Home
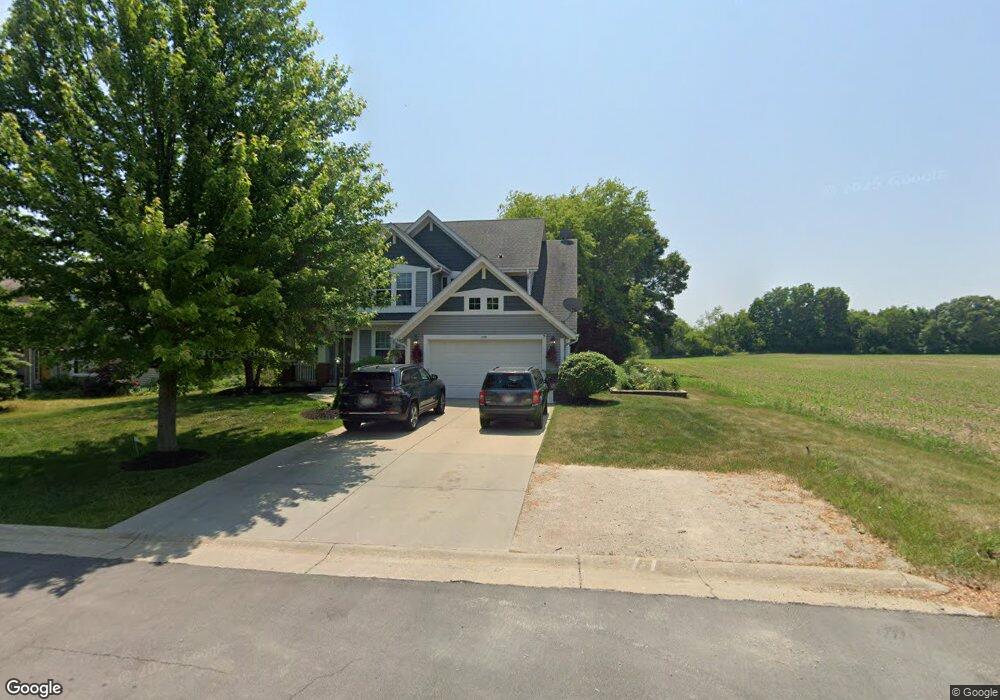
This home is located at 1579 110th St, Pleasant Prairie, WI 53158 and is currently estimated at $584,560, approximately $238 per square foot. 1579 110th St is a home located in Kenosha County with nearby schools including Prairie Lane Elementary School, Lincoln Middle School, and Tremper High School.
Ownership History
Date
Name
Owned For
Owner Type
Purchase Details
Closed on
Nov 30, 2009
Sold by
Tseronis Daniel B
Bought by
Marrero Ramon
Current Estimated Value
Purchase Details
Closed on
Aug 1, 2005
Sold by
Rode Ann M
Bought by
Tseronis Daniel B and Rose Tseronis Katherine I
Home Financials for this Owner
Home Financials are based on the most recent Mortgage that was taken out on this home.
Original Mortgage
$303,040
Interest Rate
5.66%
Mortgage Type
New Conventional
Create a Home Valuation Report for This Property
The Home Valuation Report is an in-depth analysis detailing your home's value as well as a comparison with similar homes in the area
Home Values in the Area
Average Home Value in this Area
Purchase History
| Date | Buyer | Sale Price | Title Company |
|---|---|---|---|
| Marrero Ramon | $350,000 | -- | |
| Tseronis Daniel B | $378,800 | None Available |
Source: Public Records
Mortgage History
| Date | Status | Borrower | Loan Amount |
|---|---|---|---|
| Previous Owner | Tseronis Daniel B | $303,040 |
Source: Public Records
Tax History Compared to Growth
Tax History
| Year | Tax Paid | Tax Assessment Tax Assessment Total Assessment is a certain percentage of the fair market value that is determined by local assessors to be the total taxable value of land and additions on the property. | Land | Improvement |
|---|---|---|---|---|
| 2024 | $5,907 | $515,400 | $109,400 | $406,000 |
| 2023 | $5,950 | $453,000 | $101,000 | $352,000 |
| 2022 | $6,057 | $453,000 | $101,000 | $352,000 |
| 2021 | $6,639 | $353,300 | $81,600 | $271,700 |
| 2020 | $6,639 | $353,300 | $81,600 | $271,700 |
| 2019 | $6,094 | $353,300 | $81,600 | $271,700 |
| 2018 | $6,951 | $353,300 | $81,600 | $271,700 |
| 2017 | $6,379 | $329,100 | $74,100 | $255,000 |
| 2016 | $7,012 | $329,100 | $74,100 | $255,000 |
| 2015 | $6,332 | $313,500 | $67,300 | $246,200 |
| 2014 | -- | $313,500 | $67,300 | $246,200 |
Source: Public Records
Map
Nearby Homes