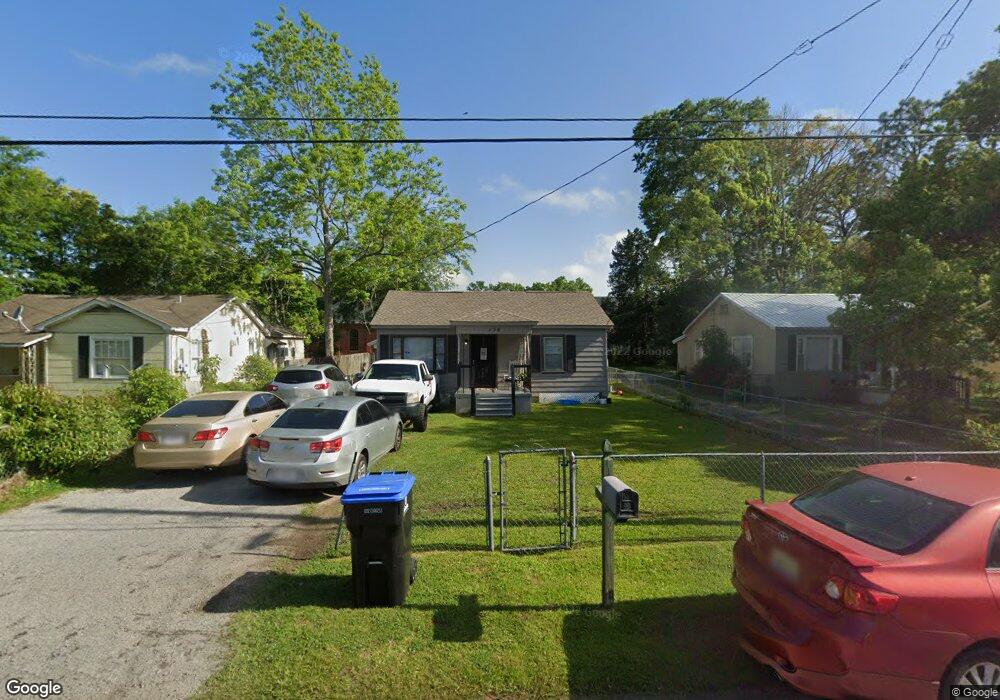
158 10th Ave Mobile, AL 36611
Estimated Value: $76,331 - $88,000
2
Beds
1
Bath
1,288
Sq Ft
$64/Sq Ft
Est. Value
About This Home
This home is located at 158 10th Ave, Mobile, AL 36611 and is currently estimated at $82,083, approximately $63 per square foot. 158 10th Ave is a home located in Mobile County with nearby schools including Chickasaw City Elementary School, Chickasaw City High School, and Word Of Life Institute Christian School.
Ownership History
Date
Name
Owned For
Owner Type
Purchase Details
Closed on
Mar 7, 2023
Sold by
Whitmer James A
Bought by
Whitmer Tracey A
Current Estimated Value
Purchase Details
Closed on
May 30, 2012
Sold by
Whitmer James A
Bought by
Third Coast Properties Llc
Purchase Details
Closed on
Mar 16, 2012
Sold by
Secretary Of Housing & Urban Development
Bought by
Whitmer James A
Purchase Details
Closed on
Mar 11, 2011
Sold by
Wells Fargo Bank Na
Bought by
The Secretary Of Housing & Urban Develop
Purchase Details
Closed on
Mar 2, 2011
Sold by
Jones Patricia and Jones Maurice
Bought by
Wells Fargo Bank N A
Purchase Details
Closed on
Aug 26, 2002
Sold by
Dyar Eddie and Dyar Rhetta
Bought by
Jones Maurice A and Jones Patricia D
Home Financials for this Owner
Home Financials are based on the most recent Mortgage that was taken out on this home.
Original Mortgage
$44,023
Interest Rate
6.49%
Mortgage Type
FHA
Create a Home Valuation Report for This Property
The Home Valuation Report is an in-depth analysis detailing your home's value as well as a comparison with similar homes in the area
Home Values in the Area
Average Home Value in this Area
Purchase History
| Date | Buyer | Sale Price | Title Company |
|---|---|---|---|
| Whitmer Tracey A | -- | -- | |
| Third Coast Properties Llc | $22,000 | None Available | |
| Whitmer James A | $22,000 | None Available | |
| The Secretary Of Housing & Urban Develop | -- | None Available | |
| Wells Fargo Bank N A | $55,061 | None Available | |
| Jones Maurice A | $44,300 | -- |
Source: Public Records
Mortgage History
| Date | Status | Borrower | Loan Amount |
|---|---|---|---|
| Previous Owner | Jones Maurice A | $44,023 |
Source: Public Records
Tax History Compared to Growth
Tax History
| Year | Tax Paid | Tax Assessment Tax Assessment Total Assessment is a certain percentage of the fair market value that is determined by local assessors to be the total taxable value of land and additions on the property. | Land | Improvement |
|---|---|---|---|---|
| 2024 | $566 | $10,400 | $1,200 | $9,200 |
| 2023 | $369 | $6,900 | $1,200 | $5,700 |
| 2022 | $342 | $6,400 | $1,200 | $5,200 |
| 2021 | $315 | $5,880 | $1,100 | $4,780 |
| 2020 | $315 | $5,880 | $1,100 | $4,780 |
| 2019 | $290 | $5,420 | $1,120 | $4,300 |
| 2018 | $286 | $5,340 | $0 | $0 |
| 2017 | $283 | $5,340 | $0 | $0 |
| 2016 | $452 | $8,520 | $0 | $0 |
| 2013 | -- | $9,120 | $0 | $0 |
Source: Public Records
Map
Nearby Homes