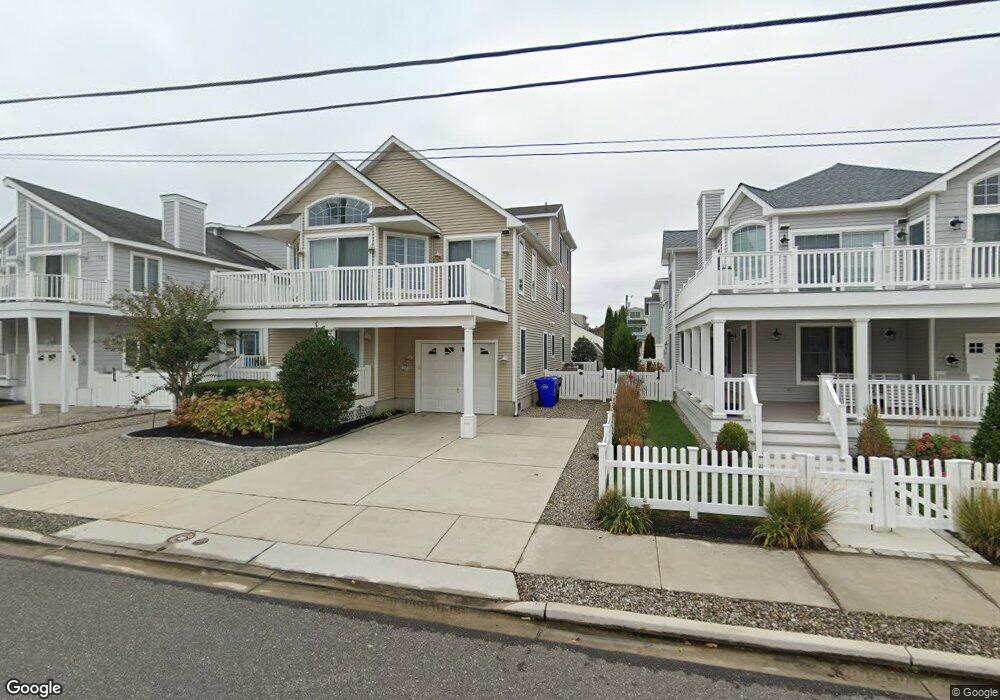
158 35th St Avalon, NJ 08202
Estimated Value: $3,914,000 - $5,062,000
Studio
--
Bath
3,264
Sq Ft
$1,389/Sq Ft
Est. Value
About This Home
This home is located at 158 35th St, Avalon, NJ 08202 and is currently estimated at $4,533,316, approximately $1,388 per square foot. 158 35th St is a home located in Cape May County with nearby schools including Avalon Elementary School.
Ownership History
Date
Name
Owned For
Owner Type
Purchase Details
Closed on
Aug 10, 2012
Sold by
Conroy William J and Conroy Sharon R
Bought by
Lee Christopher S D and Lee Soohee
Current Estimated Value
Home Financials for this Owner
Home Financials are based on the most recent Mortgage that was taken out on this home.
Original Mortgage
$1,335,000
Outstanding Balance
$204,952
Interest Rate
2.93%
Mortgage Type
New Conventional
Estimated Equity
$4,328,364
Purchase Details
Closed on
Jun 24, 2004
Sold by
Welsh Thomas J
Bought by
Conroy William J and Conroy Sharon R
Home Financials for this Owner
Home Financials are based on the most recent Mortgage that was taken out on this home.
Original Mortgage
$1,456,800
Interest Rate
3.93%
Mortgage Type
Purchase Money Mortgage
Purchase Details
Closed on
May 10, 2002
Sold by
Kuna Frank E
Bought by
Welsh Thomas J
Create a Home Valuation Report for This Property
The Home Valuation Report is an in-depth analysis detailing your home's value as well as a comparison with similar homes in the area
Home Values in the Area
Average Home Value in this Area
Purchase History
| Date | Buyer | Sale Price | Title Company |
|---|---|---|---|
| Lee Christopher S D | $1,780,000 | None Available | |
| Conroy William J | $1,821,000 | Seaboard Title Agency | |
| Welsh Thomas J | $605,000 | -- |
Source: Public Records
Mortgage History
| Date | Status | Borrower | Loan Amount |
|---|---|---|---|
| Open | Lee Christopher S D | $1,335,000 | |
| Previous Owner | Conroy William J | $1,456,800 |
Source: Public Records
Tax History
| Year | Tax Paid | Tax Assessment Tax Assessment Total Assessment is a certain percentage of the fair market value that is determined by local assessors to be the total taxable value of land and additions on the property. | Land | Improvement |
|---|---|---|---|---|
| 2025 | $13,727 | $2,235,700 | $1,300,000 | $935,700 |
| 2024 | $13,727 | $2,235,700 | $1,300,000 | $935,700 |
| 2023 | $13,615 | $2,235,700 | $1,300,000 | $935,700 |
| 2022 | $12,699 | $2,235,700 | $1,300,000 | $935,700 |
| 2021 | $12,229 | $2,235,700 | $1,300,000 | $935,700 |
| 2020 | $11,760 | $2,235,700 | $1,300,000 | $935,700 |
| 2019 | $11,402 | $2,235,700 | $1,300,000 | $935,700 |
| 2018 | $10,910 | $2,235,700 | $1,300,000 | $935,700 |
| 2017 | $9,875 | $1,776,000 | $925,000 | $851,000 |
| 2016 | $9,768 | $1,776,000 | $925,000 | $851,000 |
| 2015 | $9,608 | $1,776,000 | $925,000 | $851,000 |
| 2014 | $9,502 | $1,776,000 | $925,000 | $851,000 |
Source: Public Records
Map
Nearby Homes
- 3429 Dune Dr
- 173 33rd St Unit 3
- 253 35th St Unit WEST
- 179 32nd St
- 3149 First Ave
- 55 32nd St W Unit C2B
- 55 32nd St W
- 46 31st St W
- 3027 Dune Dr Unit 3
- 198 40th St
- 3140 Ocean Dr
- 3140 Ocean Dr Unit North
- 4040 Dune Dr
- 2968 First Ave
- 3142 Ocean Dr Unit South
- 2988 Avalon Ave
- 2958 Avalon Ave
- 4028 Ocean Dr Unit 2nd floor
- 360 39th St Unit East
- 383 39th St Unit West
Your Personal Tour Guide
Ask me questions while you tour the home.