Estimated Value: $321,000 - $394,000
3
Beds
2
Baths
2,156
Sq Ft
$165/Sq Ft
Est. Value
About This Home
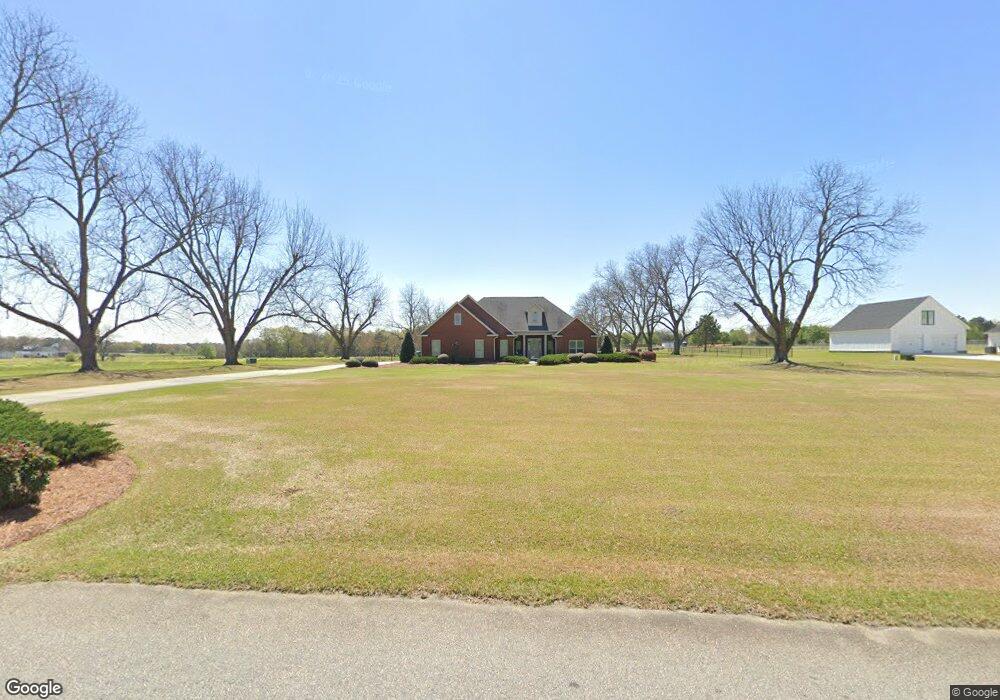
This home is located at 158 Allred Rd, Byron, GA 31008 and is currently estimated at $355,297, approximately $164 per square foot. 158 Allred Rd is a home with nearby schools including Kay Road Elementary School, Fort Valley Middle School, and Peach County High School.
Ownership History
Date
Name
Owned For
Owner Type
Purchase Details
Closed on
Oct 7, 2020
Sold by
Ryals R F
Bought by
Bookout Todd Alan and Bookout Cindy T
Current Estimated Value
Home Financials for this Owner
Home Financials are based on the most recent Mortgage that was taken out on this home.
Original Mortgage
$200,000
Outstanding Balance
$177,565
Interest Rate
2.8%
Mortgage Type
New Conventional
Estimated Equity
$177,732
Purchase Details
Closed on
Sep 21, 2012
Sold by
Sanders Chad J
Bought by
Hyals R F and Ryals Brenda
Purchase Details
Closed on
Mar 15, 2007
Sold by
Murray Mark
Bought by
Sanders Chad J and Sanders Jeanna M
Home Financials for this Owner
Home Financials are based on the most recent Mortgage that was taken out on this home.
Original Mortgage
$36,610
Interest Rate
6.27%
Mortgage Type
New Conventional
Purchase Details
Closed on
Jul 21, 1997
Bought by
Murray Mark E
Create a Home Valuation Report for This Property
The Home Valuation Report is an in-depth analysis detailing your home's value as well as a comparison with similar homes in the area
Home Values in the Area
Average Home Value in this Area
Purchase History
| Date | Buyer | Sale Price | Title Company |
|---|---|---|---|
| Bookout Todd Alan | $255,000 | -- | |
| Hyals R F | $32,000 | -- | |
| Sanders Chad J | $35,000 | -- | |
| Murray Mark E | $12,400 | -- |
Source: Public Records
Mortgage History
| Date | Status | Borrower | Loan Amount |
|---|---|---|---|
| Open | Bookout Todd Alan | $200,000 | |
| Previous Owner | Sanders Chad J | $36,610 |
Source: Public Records
Tax History Compared to Growth
Tax History
| Year | Tax Paid | Tax Assessment Tax Assessment Total Assessment is a certain percentage of the fair market value that is determined by local assessors to be the total taxable value of land and additions on the property. | Land | Improvement |
|---|---|---|---|---|
| 2024 | $3,774 | $133,760 | $22,720 | $111,040 |
| 2023 | $3,567 | $124,920 | $13,520 | $111,400 |
| 2022 | $2,994 | $111,200 | $13,520 | $97,680 |
| 2021 | $3,011 | $96,440 | $13,520 | $82,920 |
| 2020 | $2,669 | $80,960 | $13,520 | $67,440 |
| 2019 | $2,681 | $80,960 | $13,520 | $67,440 |
| 2018 | $2,694 | $80,960 | $13,520 | $67,440 |
| 2017 | $2,706 | $80,960 | $13,520 | $67,440 |
| 2016 | $2,696 | $80,960 | $13,520 | $67,440 |
| 2015 | $2,696 | $80,960 | $13,520 | $67,440 |
| 2014 | $2,696 | $80,960 | $13,520 | $67,440 |
| 2013 | -- | $13,520 | $13,520 | $0 |
Source: Public Records
Map
Nearby Homes
- 51 Allred Rd
- 113 Sweetspire Ln
- 135 Abelia Ln
- 112 Abelia Ln
- 104 Chickasaw Ct
- 476 Walker Rd
- 1046 Walker Rd
- 248 Shantz Way
- 248 Shantz Way Unit (LOT A41)
- 250 Shantz Way
- 250 Shantz Way Unit LOT A42
- 212 Eric Ct
- 262 Shantz Way
- 206 Eric Ct
- 256 Shantz Way Unit (LOT A45)
- 202 Eric Ct
- 262 Shantz Way Unit (LOT A48)
- 113 Early Dr
- 104 Early Dr
- 100 Early Dr