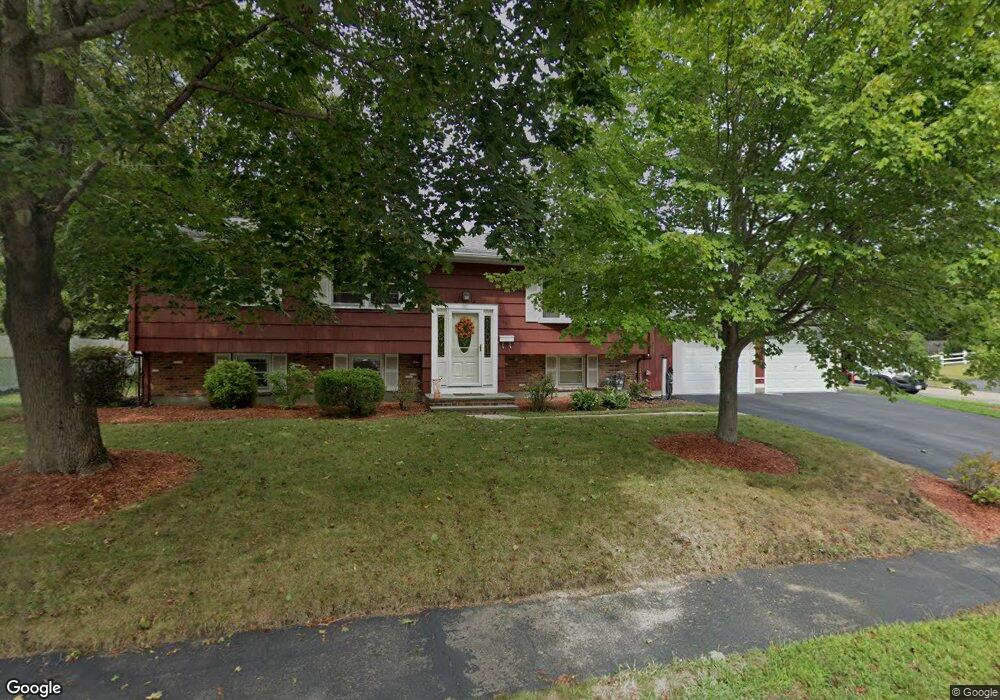
158 Beal St Rockland, MA 02370
Estimated Value: $552,000 - $593,000
3
Beds
2
Baths
1,540
Sq Ft
$377/Sq Ft
Est. Value
About This Home
This home is located at 158 Beal St, Rockland, MA 02370 and is currently estimated at $580,580, approximately $377 per square foot. 158 Beal St is a home located in Plymouth County with nearby schools including Rockland Senior High School, Calvary Chapel Academy, and Holy Family Elementary School.
Ownership History
Date
Name
Owned For
Owner Type
Purchase Details
Closed on
Jul 31, 1997
Sold by
Hartery William J and Hartery Beverly R
Bought by
Campbell James D and Campbell Susan E
Current Estimated Value
Home Financials for this Owner
Home Financials are based on the most recent Mortgage that was taken out on this home.
Original Mortgage
$120,000
Interest Rate
7.55%
Mortgage Type
Purchase Money Mortgage
Create a Home Valuation Report for This Property
The Home Valuation Report is an in-depth analysis detailing your home's value as well as a comparison with similar homes in the area
Home Values in the Area
Average Home Value in this Area
Purchase History
| Date | Buyer | Sale Price | Title Company |
|---|---|---|---|
| Campbell James D | $142,000 | -- |
Source: Public Records
Mortgage History
| Date | Status | Borrower | Loan Amount |
|---|---|---|---|
| Open | Campbell James D | $100,000 | |
| Closed | Campbell James D | $109,000 | |
| Closed | Campbell James D | $120,000 | |
| Previous Owner | Campbell James D | $50,000 |
Source: Public Records
Tax History Compared to Growth
Tax History
| Year | Tax Paid | Tax Assessment Tax Assessment Total Assessment is a certain percentage of the fair market value that is determined by local assessors to be the total taxable value of land and additions on the property. | Land | Improvement |
|---|---|---|---|---|
| 2025 | $6,953 | $508,600 | $228,100 | $280,500 |
| 2024 | $6,749 | $480,000 | $215,200 | $264,800 |
| 2023 | $6,599 | $433,600 | $197,400 | $236,200 |
| 2022 | $6,320 | $377,300 | $171,600 | $205,700 |
| 2021 | $5,148 | $337,800 | $156,000 | $181,800 |
| 2020 | $0 | $321,900 | $148,600 | $173,300 |
| 2019 | $0 | $304,900 | $141,600 | $163,300 |
| 2018 | $5,209 | $285,900 | $141,600 | $144,300 |
| 2017 | $4,171 | $273,100 | $141,600 | $131,500 |
| 2016 | $4,885 | $264,200 | $136,100 | $128,100 |
| 2015 | $4,666 | $245,200 | $127,200 | $118,000 |
| 2014 | $4,358 | $237,600 | $124,800 | $112,800 |
Source: Public Records
Map
Nearby Homes
- 436 E Water St
- 354 Webster St
- 206-208 Hinghm St
- 507 Liberty St
- 92 Liberty St
- 49 Liberty St
- 63 Webster St
- 216 Whiting St
- 45-47 Park St
- 133 Crescent St
- 94-96 Crescent St
- 18 Midfield Dr
- 83 Summit St
- 12 Linden St
- 38 Levin Rd
- 718 Market St
- 13 Dyer St Unit 13
- 14 Dyer St Unit 14
- 12 Dyer St Unit 12
- 50 Linden Park