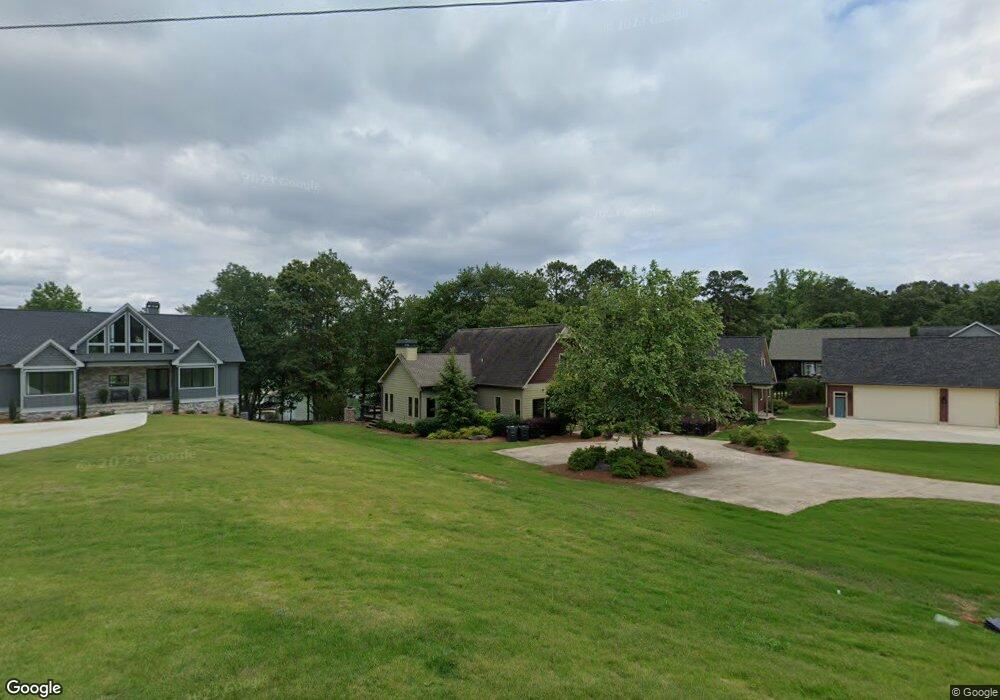
158 Browns Ln Unit N/ Hartwell, GA 30643
Estimated Value: $758,000 - $976,000
4
Beds
3
Baths
2,250
Sq Ft
$373/Sq Ft
Est. Value
About This Home
This home is located at 158 Browns Ln Unit N/, Hartwell, GA 30643 and is currently estimated at $839,174, approximately $372 per square foot. 158 Browns Ln Unit N/ is a home located in Hart County with nearby schools including Hart County High School.
Ownership History
Date
Name
Owned For
Owner Type
Purchase Details
Closed on
Dec 16, 2020
Sold by
Ying Jun
Bought by
Newman Jackie L
Current Estimated Value
Home Financials for this Owner
Home Financials are based on the most recent Mortgage that was taken out on this home.
Original Mortgage
$510,300
Outstanding Balance
$454,319
Interest Rate
2.7%
Mortgage Type
New Conventional
Estimated Equity
$384,855
Purchase Details
Closed on
Feb 22, 2008
Sold by
Lee Charlene F
Bought by
Ying Jun and Ying Victoria D
Purchase Details
Closed on
May 20, 2005
Sold by
Hendrix B Jean
Bought by
Lee Charlene
Home Financials for this Owner
Home Financials are based on the most recent Mortgage that was taken out on this home.
Original Mortgage
$300,000
Interest Rate
6.95%
Mortgage Type
New Conventional
Purchase Details
Closed on
Oct 1, 1998
Purchase Details
Closed on
Jun 1, 1996
Purchase Details
Closed on
Sep 1, 1966
Create a Home Valuation Report for This Property
The Home Valuation Report is an in-depth analysis detailing your home's value as well as a comparison with similar homes in the area
Home Values in the Area
Average Home Value in this Area
Purchase History
| Date | Buyer | Sale Price | Title Company |
|---|---|---|---|
| Newman Jackie L | $567,000 | -- | |
| Ying Jun | $500,000 | -- | |
| Lee Charlene | $375,000 | -- | |
| -- | -- | -- | |
| -- | $65,000 | -- | |
| -- | -- | -- |
Source: Public Records
Mortgage History
| Date | Status | Borrower | Loan Amount |
|---|---|---|---|
| Open | Newman Jackie L | $510,300 | |
| Previous Owner | Lee Charlene | $300,000 | |
| Previous Owner | Lee Charlene | $75,000 |
Source: Public Records
Tax History Compared to Growth
Tax History
| Year | Tax Paid | Tax Assessment Tax Assessment Total Assessment is a certain percentage of the fair market value that is determined by local assessors to be the total taxable value of land and additions on the property. | Land | Improvement |
|---|---|---|---|---|
| 2024 | $3,332 | $215,787 | $116,000 | $99,787 |
| 2023 | $3,344 | $200,810 | $116,000 | $84,810 |
| 2022 | $3,027 | $181,798 | $106,000 | $75,798 |
| 2021 | $2,622 | $141,336 | $74,000 | $67,336 |
| 2020 | $2,542 | $131,274 | $70,000 | $61,274 |
| 2019 | $2,478 | $126,778 | $68,000 | $58,778 |
| 2018 | $2,363 | $119,516 | $61,200 | $58,316 |
| 2017 | $2,365 | $118,965 | $61,200 | $57,765 |
| 2016 | $2,443 | $119,074 | $61,200 | $57,874 |
| 2015 | $2,296 | $117,918 | $61,200 | $56,718 |
| 2014 | $2,682 | $135,038 | $74,800 | $60,238 |
| 2013 | -- | $136,683 | $74,800 | $61,883 |
Source: Public Records
Map
Nearby Homes
- 120 Providence Point Ln
- 370 Paradise Point Rd
- 339 Lightwood Ln
- 425 Wyndward Point Dr
- 36 Crest Dr Unit Lot 23
- 40 Crest Dr Unit 24
- 47 Rabbit Run
- 0 Pineywoods Rd Unit 10551989
- 85 Majestic Shores Trail
- LOT E Majestic Shores Rd
- LOT 25 Majestic Shores Rd
- LOT 23 Majestic Shores Rd
- LOT 22 Majestic Shores Rd
- LOT 13 Majestic Shores Rd
- LOT 12 Majestic Shores Rd
- LOT 7 Majestic Shores Rd
- LOT 6 Majestic Shores Rd
- LOT 5 Majestic Shores Rd
- LOT 4 Majestic Shores Rd
- Branford Plan at Majestic Shores
- 158 Browns Ln
- 144 Browns Ln
- 172 Browns Ln
- 172 Browns Ln
- 70 Browns Ln
- 70 Browns Ln Unit Lot 2
- Lot B Browns Ln
- 230 Browns Ln
- 60 Browns Ln
- 60 Browns Ln Unit Lot 3
- 87 Browns Ln
- 24 Browns Ln
- 69 Yacht Club Pointe Point
- 75 Yacht Club Rd
- 75 Yacht Club Rd Unit 1
- 44 Paradise Ln
- 1 Massey Subdivision Rd
- 23 Massey Subdivision Rd
- 1114 Yacht Club Rd
- LOT 4 Yacht Club Point