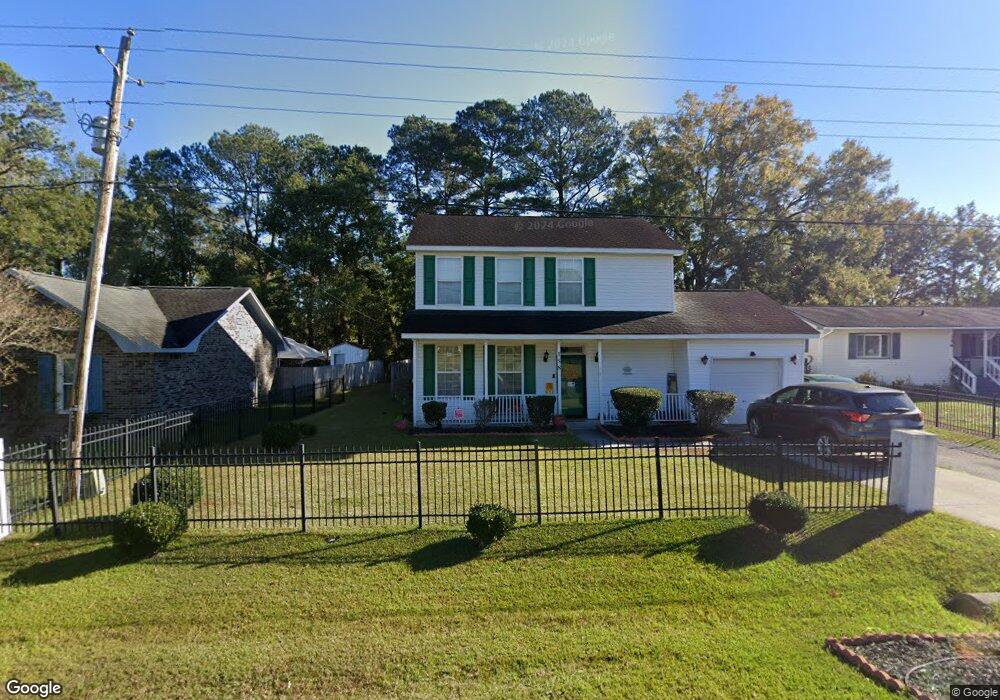
158 Charles B Gibson Blvd Goose Creek, SC 29445
Estimated Value: $275,000 - $309,000
--
Bed
--
Bath
1,456
Sq Ft
$201/Sq Ft
Est. Value
About This Home
This home is located at 158 Charles B Gibson Blvd, Goose Creek, SC 29445 and is currently estimated at $292,476, approximately $200 per square foot. 158 Charles B Gibson Blvd is a home located in Berkeley County with nearby schools including Mount Holly Elementary, Sedgefield Middle School, and Goose Creek High School.
Ownership History
Date
Name
Owned For
Owner Type
Purchase Details
Closed on
Jun 7, 2021
Sold by
Briscoe Joyce E
Bought by
Hayward Ben and Hayward Delores
Current Estimated Value
Home Financials for this Owner
Home Financials are based on the most recent Mortgage that was taken out on this home.
Original Mortgage
$225,834
Outstanding Balance
$204,465
Interest Rate
2.9%
Mortgage Type
FHA
Estimated Equity
$88,011
Purchase Details
Closed on
Sep 26, 2012
Sold by
Palmer Roxanna
Bought by
Palmer Rosanna and Palmer Living Trust
Purchase Details
Closed on
Sep 29, 2006
Sold by
Griffin Jennifer
Bought by
Briscoe Joyce E
Home Financials for this Owner
Home Financials are based on the most recent Mortgage that was taken out on this home.
Original Mortgage
$157,634
Interest Rate
6.36%
Mortgage Type
FHA
Purchase Details
Closed on
Oct 24, 2003
Sold by
O S Builders Inc
Bought by
Griffin Jennifer
Purchase Details
Closed on
Jun 21, 2002
Sold by
Lane Regina
Bought by
O S Builders Inc
Create a Home Valuation Report for This Property
The Home Valuation Report is an in-depth analysis detailing your home's value as well as a comparison with similar homes in the area
Home Values in the Area
Average Home Value in this Area
Purchase History
| Date | Buyer | Sale Price | Title Company |
|---|---|---|---|
| Hayward Ben | $230,000 | Weeks & Irvine Llc | |
| Palmer Rosanna | -- | -- | |
| Briscoe Joyce E | $159,000 | None Available | |
| Griffin Jennifer | $117,000 | -- | |
| O S Builders Inc | $10,000 | -- |
Source: Public Records
Mortgage History
| Date | Status | Borrower | Loan Amount |
|---|---|---|---|
| Open | Hayward Ben | $225,834 | |
| Previous Owner | Briscoe Joyce E | $157,634 |
Source: Public Records
Tax History Compared to Growth
Tax History
| Year | Tax Paid | Tax Assessment Tax Assessment Total Assessment is a certain percentage of the fair market value that is determined by local assessors to be the total taxable value of land and additions on the property. | Land | Improvement |
|---|---|---|---|---|
| 2025 | $1,220 | $263,810 | $78,378 | $185,432 |
| 2024 | $1,220 | $10,552 | $3,135 | $7,417 |
| 2023 | $1,220 | $10,552 | $3,135 | $7,417 |
| 2022 | $1,210 | $9,176 | $1,800 | $7,376 |
| 2021 | $797 | $5,210 | $897 | $4,310 |
| 2020 | $805 | $5,207 | $897 | $4,310 |
| 2019 | $800 | $5,207 | $897 | $4,310 |
| 2018 | $748 | $4,528 | $1,200 | $3,328 |
| 2017 | $708 | $4,528 | $1,200 | $3,328 |
| 2016 | $722 | $4,530 | $1,200 | $3,330 |
| 2015 | $694 | $4,530 | $1,200 | $3,330 |
| 2014 | $684 | $4,700 | $1,200 | $3,500 |
| 2013 | -- | $4,700 | $1,200 | $3,500 |
Source: Public Records
Map
Nearby Homes
- 162 Charles B Gibson Ave
- 123 Millburn Ave
- 429 Rubyridge Ln
- 19 Glenville Ave
- 304 Bremerton Dr
- 300 Bremerton Dr
- 13 Rumson Rd
- 154 Rahway Rd Unit H
- 326 Bremerton Dr
- Foster II Plan at Windward Townes
- 306 Bremerton Dr
- 362 Bremerton Dr
- 112 Roselle Ave
- 356 Bremerton Dr
- 358 Bremerton Dr
- 5 Summit Ave
- 58 Princeton Rd
- 30 Oak Grove Rd
- 540 Truman Dr
- 25 Delaware Rd
- 158 Charles B Gibson Ave
- 156 Charles B Gibson Blvd
- 160 Charles B Gibson Blvd
- 156 Charles B Gibson Ave
- 162 Charles B Gibson Ave Unit 1
- 162 Charles B Gibson Blvd
- 139 Summit Ave
- 137 Summit Ave
- 135 Summit Ave
- 141 Summit Ave
- 164 Charles B Gibson Blvd
- 133 Summit Ave
- 143 Summit Ave
- 131 Summit Ave
- 166 Charles B Gibson Blvd
- 166 Charles B Gibson Ave
- 145 Summit Ave
- 140 Summit Ave
- 129 Summit Ave
- 134 Summit Ave