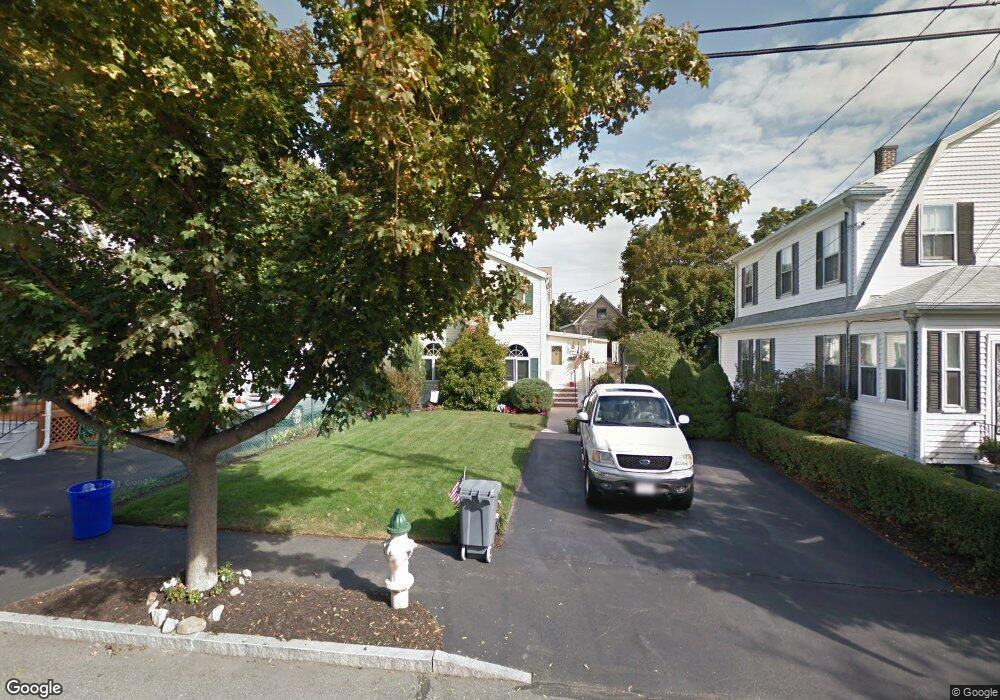
158 Darrow St Quincy, MA 02169
Houghs Neck NeighborhoodEstimated Value: $675,313 - $724,000
3
Beds
2
Baths
1,601
Sq Ft
$443/Sq Ft
Est. Value
About This Home
This home is located at 158 Darrow St, Quincy, MA 02169 and is currently estimated at $709,328, approximately $443 per square foot. 158 Darrow St is a home located in Norfolk County with nearby schools including Atherton Hough Elementary School, Broad Meadows Middle School, and Quincy High School.
Ownership History
Date
Name
Owned For
Owner Type
Purchase Details
Closed on
Jan 13, 2024
Sold by
Gibbons Shaun P
Bought by
Gibbons Rt Of 2024 and Gibbons
Current Estimated Value
Purchase Details
Closed on
Jan 8, 2024
Sold by
Gibbons Richard J and Gibbons Eleanor A
Bought by
Gibbons Shaun P
Purchase Details
Closed on
Oct 29, 1982
Bought by
Gibbons Richard J
Create a Home Valuation Report for This Property
The Home Valuation Report is an in-depth analysis detailing your home's value as well as a comparison with similar homes in the area
Home Values in the Area
Average Home Value in this Area
Purchase History
| Date | Buyer | Sale Price | Title Company |
|---|---|---|---|
| Gibbons Rt Of 2024 | -- | None Available | |
| Gibbons Shaun P | -- | None Available | |
| Gibbons Richard J | $47,900 | -- |
Source: Public Records
Mortgage History
| Date | Status | Borrower | Loan Amount |
|---|---|---|---|
| Previous Owner | Gibbons Richard J | $65,000 | |
| Previous Owner | Gibbons Richard J | $120,000 | |
| Previous Owner | Gibbons Richard J | $120,000 |
Source: Public Records
Tax History Compared to Growth
Tax History
| Year | Tax Paid | Tax Assessment Tax Assessment Total Assessment is a certain percentage of the fair market value that is determined by local assessors to be the total taxable value of land and additions on the property. | Land | Improvement |
|---|---|---|---|---|
| 2025 | $6,873 | $596,100 | $239,100 | $357,000 |
| 2024 | $6,321 | $560,900 | $217,400 | $343,500 |
| 2023 | $5,822 | $523,100 | $197,600 | $325,500 |
| 2022 | $5,955 | $497,100 | $171,800 | $325,300 |
| 2021 | $5,589 | $460,400 | $171,800 | $288,600 |
| 2020 | $4,940 | $397,400 | $171,800 | $225,600 |
| 2019 | $4,780 | $380,900 | $159,100 | $221,800 |
| 2018 | $4,518 | $338,700 | $138,300 | $200,400 |
| 2017 | $4,850 | $342,300 | $138,300 | $204,000 |
| 2016 | $4,531 | $315,500 | $125,700 | $189,800 |
| 2015 | $4,240 | $290,400 | $116,500 | $173,900 |
| 2014 | $4,045 | $272,200 | $116,500 | $155,700 |
Source: Public Records
Map
Nearby Homes