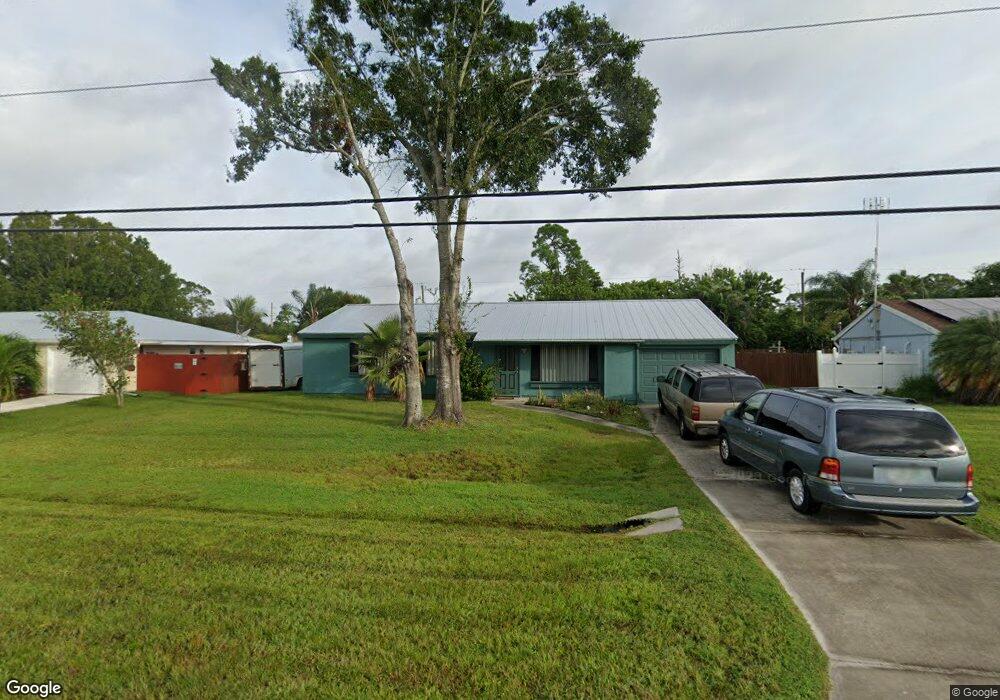
158 Englar Dr Sebastian, FL 32958
Sebastian Highlands NeighborhoodEstimated Value: $246,787 - $276,000
3
Beds
2
Baths
1,176
Sq Ft
$221/Sq Ft
Est. Value
About This Home
This home is located at 158 Englar Dr, Sebastian, FL 32958 and is currently estimated at $260,197, approximately $221 per square foot. 158 Englar Dr is a home located in Indian River County with nearby schools including Pelican Island Classical Magnet School, Storm Grove Middle School, and Sebastian River High School.
Ownership History
Date
Name
Owned For
Owner Type
Purchase Details
Closed on
Mar 3, 2025
Sold by
Mercier Debra
Bought by
Mercier Debra and Mercier Norman
Current Estimated Value
Purchase Details
Closed on
Mar 1, 2016
Sold by
Stevens Nicholas M and Stevens Christa Lynn
Bought by
Mercier Debra
Purchase Details
Closed on
Oct 21, 2009
Sold by
Deutsche Bank National Trust Company
Bought by
Stevens Nick
Purchase Details
Closed on
May 5, 2009
Sold by
Coxon Chris J
Bought by
Deutsche Bank National Trust Company
Purchase Details
Closed on
Nov 26, 1997
Sold by
Settle Mavis
Bought by
Caxon Chris J
Create a Home Valuation Report for This Property
The Home Valuation Report is an in-depth analysis detailing your home's value as well as a comparison with similar homes in the area
Home Values in the Area
Average Home Value in this Area
Purchase History
| Date | Buyer | Sale Price | Title Company |
|---|---|---|---|
| Mercier Debra | -- | None Listed On Document | |
| Mercier Debra | -- | None Listed On Document | |
| Mercier Debra | -- | Attorney | |
| Mercier Debra | $71,200 | Attorney | |
| Stevens Nick | $45,000 | Servicelink | |
| Deutsche Bank National Trust Company | $35,000 | None Available | |
| Caxon Chris J | $45,400 | -- |
Source: Public Records
Tax History
| Year | Tax Paid | Tax Assessment Tax Assessment Total Assessment is a certain percentage of the fair market value that is determined by local assessors to be the total taxable value of land and additions on the property. | Land | Improvement |
|---|---|---|---|---|
| 2025 | $3,416 | $179,326 | $47,525 | $131,801 |
| 2024 | $2,738 | $182,130 | $47,525 | $134,605 |
| 2023 | $2,738 | $140,110 | $0 | $0 |
| 2022 | $2,420 | $149,466 | $32,902 | $116,564 |
| 2021 | $2,208 | $123,006 | $29,246 | $93,760 |
| 2020 | $2,038 | $108,395 | $28,515 | $79,880 |
| 2019 | $1,876 | $95,697 | $19,741 | $75,956 |
| 2018 | $1,804 | $89,057 | $16,085 | $72,972 |
| 2017 | $1,800 | $90,043 | $0 | $0 |
| 2016 | $1,330 | $71,030 | $0 | $0 |
| 2015 | $1,217 | $58,000 | $0 | $0 |
| 2014 | $1,079 | $51,490 | $0 | $0 |
Source: Public Records
Map
Nearby Homes
- 111 Alameda Ave
- 117 Osceola Ave
- 126 Ormond Ct
- 110 Cardinal Dr
- 1167 Schumann Dr
- 221 Caprol Ln
- 975 S Easy St
- 110 Marsh St
- 106 King Fisher Way
- 918 Schumann Dr
- 909 Canal Cir
- 1119 George St
- 739 S Easy St
- 111 Chaloupe Terrace
- 170 Spring Valley Ave
- 103 Wood Stork Way
- 1001 Carnation Dr
- 302 Quarry Ln
- 449 Englar Dr
- 101 Joy Haven Dr
Your Personal Tour Guide
Ask me questions while you tour the home.