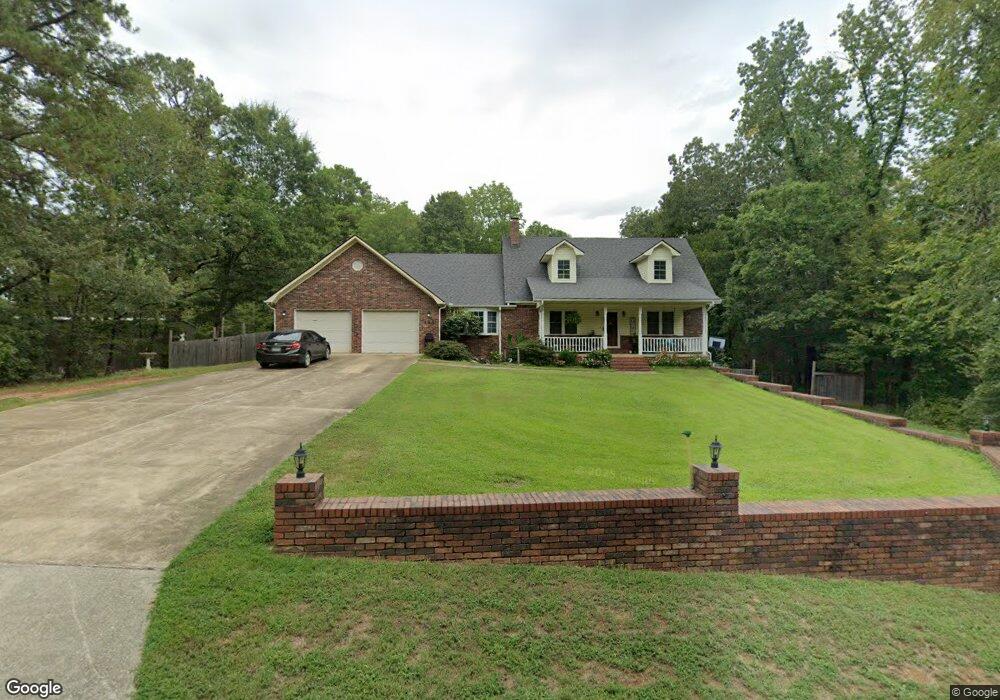
158 Golden Oak Cir Hot Springs National Park, AR 71913
Estimated Value: $399,591 - $444,000
4
Beds
3
Baths
1,892
Sq Ft
$224/Sq Ft
Est. Value
About This Home
This home is located at 158 Golden Oak Cir, Hot Springs National Park, AR 71913 and is currently estimated at $422,898, approximately $223 per square foot. 158 Golden Oak Cir is a home located in Garland County with nearby schools including Lake Hamilton Primary School, Lake Hamilton Elementary School, and Lake Hamilton Interm. School.
Ownership History
Date
Name
Owned For
Owner Type
Purchase Details
Closed on
Oct 15, 2015
Sold by
Collins Thomas H and Collins Living Trust
Bought by
Fetterhoff Dallas and Fetterhoff Coreena
Current Estimated Value
Home Financials for this Owner
Home Financials are based on the most recent Mortgage that was taken out on this home.
Original Mortgage
$218,500
Outstanding Balance
$171,735
Interest Rate
3.93%
Mortgage Type
New Conventional
Estimated Equity
$251,163
Purchase Details
Closed on
Aug 24, 1999
Sold by
Not Provided
Bought by
Collins Liv Trust
Purchase Details
Closed on
May 29, 1998
Sold by
Not Provided
Bought by
Collins Thomas H and Collins Mollie
Purchase Details
Closed on
Jul 7, 1993
Sold by
Not Provided
Bought by
Kolb Frances E
Purchase Details
Closed on
Jan 1, 1901
Bought by
Jackson Randy and P.O. Box 2973
Create a Home Valuation Report for This Property
The Home Valuation Report is an in-depth analysis detailing your home's value as well as a comparison with similar homes in the area
Home Values in the Area
Average Home Value in this Area
Purchase History
| Date | Buyer | Sale Price | Title Company |
|---|---|---|---|
| Fetterhoff Dallas | $230,000 | Garland County Title | |
| Collins Liv Trust | -- | -- | |
| Collins Thomas H | $165,000 | -- | |
| Kolb Frances E | $158,999 | -- | |
| Jackson Randy | -- | -- |
Source: Public Records
Mortgage History
| Date | Status | Borrower | Loan Amount |
|---|---|---|---|
| Open | Jackson Randy | $77,027 | |
| Open | Fetterhoff Dallas | $218,500 |
Source: Public Records
Tax History Compared to Growth
Tax History
| Year | Tax Paid | Tax Assessment Tax Assessment Total Assessment is a certain percentage of the fair market value that is determined by local assessors to be the total taxable value of land and additions on the property. | Land | Improvement |
|---|---|---|---|---|
| 2025 | $1,517 | $71,630 | $4,570 | $67,060 |
| 2024 | $1,502 | $71,630 | $4,570 | $67,060 |
| 2023 | $1,490 | $71,630 | $4,570 | $67,060 |
| 2022 | $1,898 | $71,630 | $4,570 | $67,060 |
| 2021 | $1,827 | $39,740 | $1,430 | $38,310 |
| 2020 | $1,452 | $39,740 | $1,430 | $38,310 |
| 2019 | $1,382 | $39,740 | $1,430 | $38,310 |
| 2018 | $1,382 | $39,740 | $1,430 | $38,310 |
| 2017 | $1,407 | $39,740 | $1,430 | $38,310 |
| 2016 | $1,460 | $40,940 | $3,070 | $37,870 |
| 2015 | $1,460 | $40,940 | $3,070 | $37,870 |
| 2014 | $1,459 | $40,940 | $3,070 | $37,870 |
Source: Public Records
Map
Nearby Homes
- 136 Shady Oak Trail
- 156 Shady Oak Trail
- 168 Golden Oak Place
- 152 Muskogee Rd
- 118 Muskogee Rd
- 105 Tall Oaks St
- 111 Black Oak Ct
- 165 Tobacco Rd
- 0 River Mill Ct Unit 25041085
- Lots 35 & 36 Maricopa Dr
- 469 Treasure Isle Rd
- 179 River Mill C-1 Ct
- 179 River Mill D-1 Ct
- 179 River Mill B-2 Ct
- 179 River Mill Ct Unit B2
- 179 River Mill Ct Unit D1
- 179 River Mill Ct Unit C1
- 183 River Mill Ct Unit B-1
- 183 River Mill Ct Unit B-2
- 183 River Mill Ct
- 200 Golden Oak Cir
- 161 Golden Oak Cir
- 204 Golden Oak Cir
- 129 Golden Oak Cir
- 115 Golden Oak Cir
- 100 Golden Oak Place
- 106 Golden Oak Place
- 120 Shady Oak Trail
- 201 Golden Oak Cir
- 203 Golden Oak Cir Unit Hot Springs, AR 7191
- 203 Cir
- 0 Live Oak Terrace Terrace
- 134 Golden Oak Place
- 205 Golden Oak Cir
- 100 Black Oak Ct
- 138 Shady Oak Trail
- 142 Shady Oak Trail
- 149 Shady Oak Trail
- 101 Live Oak Terrace
- 138 Golden Oak Place