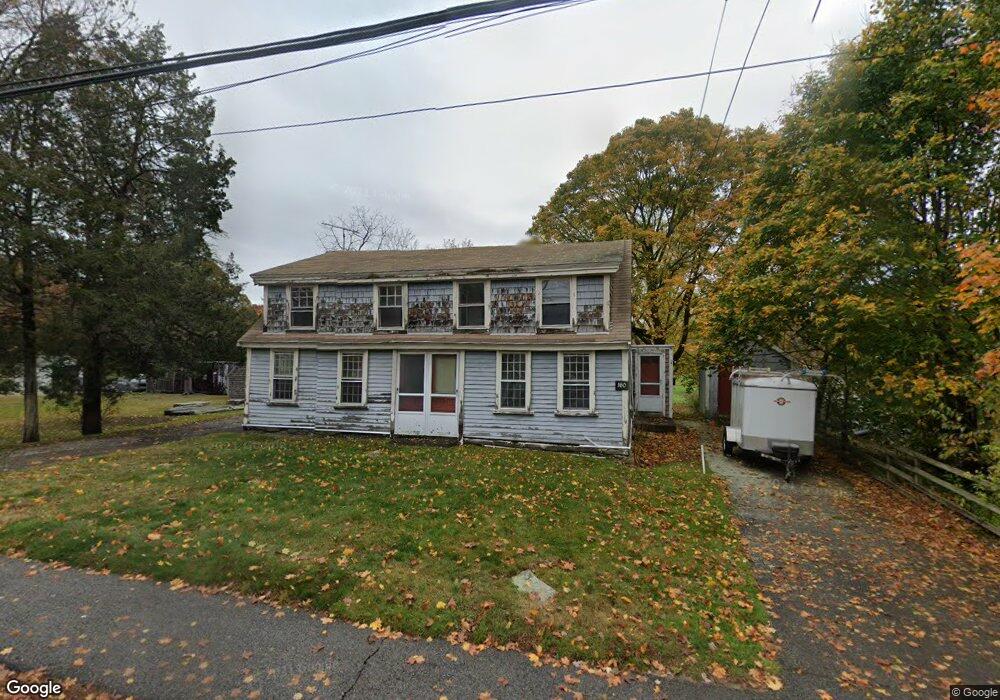
158 Hersey St Hingham, MA 02043
Estimated Value: $893,000 - $983,000
5
Beds
2
Baths
1,459
Sq Ft
$643/Sq Ft
Est. Value
About This Home
This home is located at 158 Hersey St, Hingham, MA 02043 and is currently estimated at $937,765, approximately $642 per square foot. 158 Hersey St is a home located in Plymouth County with nearby schools including William L. Foster Elementary School, Hingham Middle School, and Hingham High School.
Ownership History
Date
Name
Owned For
Owner Type
Purchase Details
Closed on
Aug 7, 2025
Sold by
Hersey Street 158-160 Llc
Bought by
South Shore Cap Group Llc
Current Estimated Value
Home Financials for this Owner
Home Financials are based on the most recent Mortgage that was taken out on this home.
Original Mortgage
$1,912,500
Outstanding Balance
$1,907,552
Interest Rate
6.77%
Mortgage Type
New Conventional
Estimated Equity
-$969,787
Purchase Details
Closed on
Jan 28, 2016
Sold by
Hersey Peter W and Priestly Elizabeth H
Bought by
Hersey Street 158-160
Home Financials for this Owner
Home Financials are based on the most recent Mortgage that was taken out on this home.
Original Mortgage
$193,000
Interest Rate
3.97%
Mortgage Type
New Conventional
Purchase Details
Closed on
Sep 1, 2006
Sold by
Reuben W Hersey Ft and Hersey
Bought by
Hersey Paul E and Hersey Peter W
Create a Home Valuation Report for This Property
The Home Valuation Report is an in-depth analysis detailing your home's value as well as a comparison with similar homes in the area
Purchase History
| Date | Buyer | Sale Price | Title Company |
|---|---|---|---|
| South Shore Cap Group Llc | $900,000 | -- | |
| South Shore Cap Group Llc | $900,000 | -- | |
| Hersey Street 158-160 | -- | -- | |
| Hersey Street 158-160 | -- | -- | |
| Hersey Paul E | -- | -- | |
| Hersey Paul E | -- | -- |
Source: Public Records
Mortgage History
| Date | Status | Borrower | Loan Amount |
|---|---|---|---|
| Open | South Shore Cap Group Llc | $1,912,500 | |
| Closed | South Shore Cap Group Llc | $1,912,500 | |
| Previous Owner | Hersey Street 158-160 | $193,000 |
Source: Public Records
Tax History
| Year | Tax Paid | Tax Assessment Tax Assessment Total Assessment is a certain percentage of the fair market value that is determined by local assessors to be the total taxable value of land and additions on the property. | Land | Improvement |
|---|---|---|---|---|
| 2025 | $7,074 | $661,700 | $454,900 | $206,800 |
| 2024 | $7,179 | $661,700 | $454,900 | $206,800 |
| 2023 | $6,247 | $624,700 | $454,900 | $169,800 |
| 2022 | $6,247 | $540,400 | $379,100 | $161,300 |
| 2021 | $6,153 | $521,400 | $379,100 | $142,300 |
| 2020 | $6,201 | $537,800 | $379,100 | $158,700 |
| 2019 | $5,790 | $509,800 | $379,100 | $130,700 |
| 2018 | $5,753 | $488,800 | $379,100 | $109,700 |
| 2017 | $5,549 | $472,300 | $362,600 | $109,700 |
| 2016 | $5,737 | $459,300 | $345,400 | $113,900 |
| 2015 | $5,409 | $431,700 | $329,000 | $102,700 |
Source: Public Records
Map
Nearby Homes
Your Personal Tour Guide
Ask me questions while you tour the home.