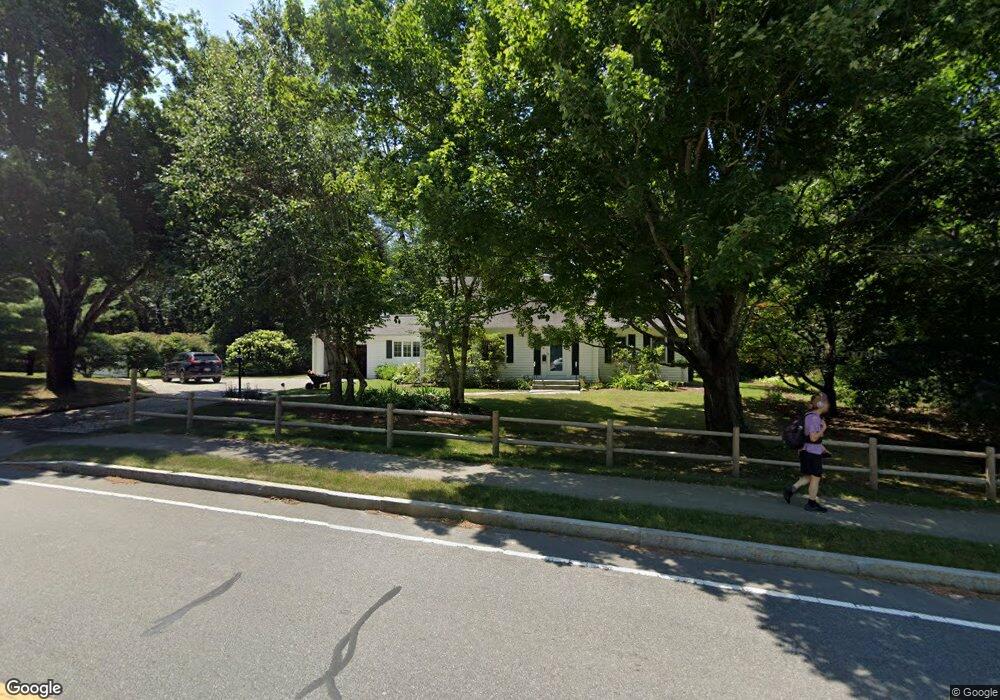
158 High Rock St Needham, MA 02492
Estimated Value: $1,507,000 - $1,832,223
5
Beds
2
Baths
1,565
Sq Ft
$1,089/Sq Ft
Est. Value
About This Home
This home is located at 158 High Rock St, Needham, MA 02492 and is currently estimated at $1,703,556, approximately $1,088 per square foot. 158 High Rock St is a home located in Norfolk County with nearby schools including Newman Elementary School, High Rock Middle School, and Pollard Middle School.
Ownership History
Date
Name
Owned For
Owner Type
Purchase Details
Closed on
Sep 30, 1997
Sold by
Banks Janice E
Bought by
Haney John F
Current Estimated Value
Home Financials for this Owner
Home Financials are based on the most recent Mortgage that was taken out on this home.
Original Mortgage
$303,200
Outstanding Balance
$48,798
Interest Rate
7.47%
Mortgage Type
Purchase Money Mortgage
Estimated Equity
$1,654,758
Create a Home Valuation Report for This Property
The Home Valuation Report is an in-depth analysis detailing your home's value as well as a comparison with similar homes in the area
Home Values in the Area
Average Home Value in this Area
Purchase History
| Date | Buyer | Sale Price | Title Company |
|---|---|---|---|
| Haney John F | $379,000 | -- |
Source: Public Records
Mortgage History
| Date | Status | Borrower | Loan Amount |
|---|---|---|---|
| Open | Haney John F | $303,200 | |
| Previous Owner | Haney John F | $100,000 |
Source: Public Records
Tax History Compared to Growth
Tax History
| Year | Tax Paid | Tax Assessment Tax Assessment Total Assessment is a certain percentage of the fair market value that is determined by local assessors to be the total taxable value of land and additions on the property. | Land | Improvement |
|---|---|---|---|---|
| 2025 | $14,297 | $1,348,800 | $836,800 | $512,000 |
| 2024 | $13,037 | $1,041,300 | $548,800 | $492,500 |
| 2023 | $13,180 | $1,010,700 | $548,800 | $461,900 |
| 2022 | $13,341 | $997,800 | $548,800 | $449,000 |
| 2021 | $13,001 | $997,800 | $548,800 | $449,000 |
| 2020 | $12,555 | $1,005,200 | $548,800 | $456,400 |
| 2019 | $12,409 | $1,001,500 | $548,800 | $452,700 |
| 2018 | $11,898 | $1,001,500 | $548,800 | $452,700 |
| 2017 | $11,288 | $949,400 | $548,800 | $400,600 |
| 2016 | $10,446 | $905,200 | $548,800 | $356,400 |
| 2015 | $10,220 | $905,200 | $548,800 | $356,400 |
| 2014 | $10,474 | $899,800 | $548,800 | $351,000 |
Source: Public Records
Map
Nearby Homes
- 144 High Rock St
- 168 High Rock St
- 71 Emerson Rd
- 169 High Rock St
- 569 Chestnut St
- 74 Emerson Rd
- 563 Chestnut St
- 178 High Rock St
- 557 Chestnut St
- 68 Emerson Rd
- 65 Emerson Rd
- 591 Chestnut St
- 549 Chestnut St
- 179 High Rock St
- 62 Emerson Rd
- 57 Emerson Rd
- 129 High Rock St
- 564 Chestnut St
- 543 Chestnut St
- 558 Chestnut St