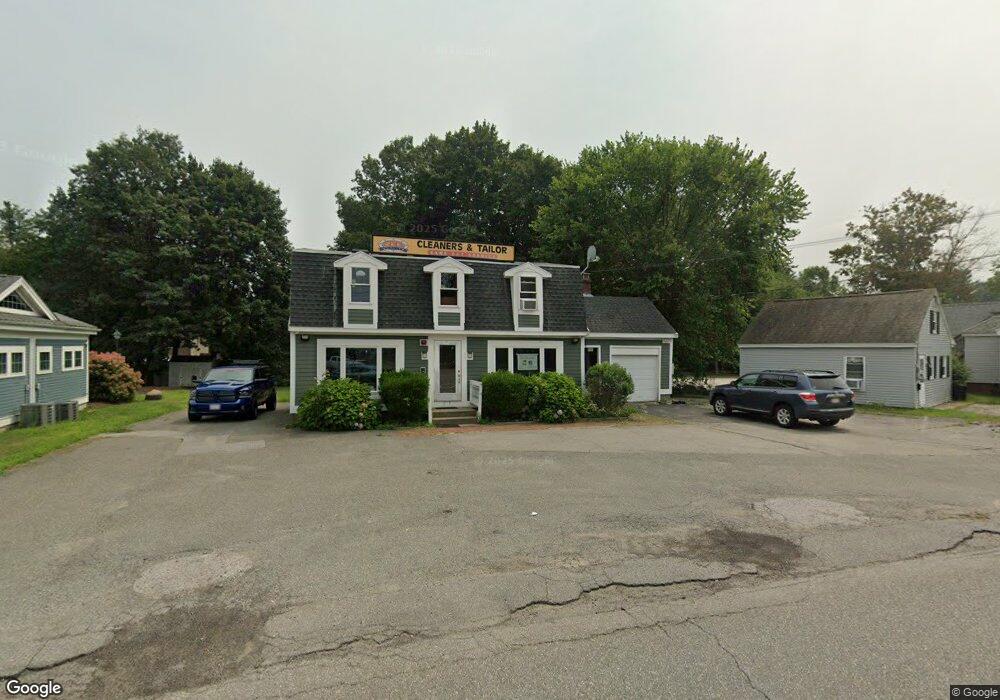
158 Main St Northborough, MA 01532
Estimated Value: $652,976
4
Beds
2
Baths
1,992
Sq Ft
$328/Sq Ft
Est. Value
About This Home
This home is located at 158 Main St, Northborough, MA 01532 and is currently estimated at $652,976, approximately $327 per square foot. 158 Main St is a home located in Worcester County with nearby schools including Marguerite E. Peaslee Elementary School, Robert E. Melican Middle School, and Algonquin Regional High School.
Ownership History
Date
Name
Owned For
Owner Type
Purchase Details
Closed on
Feb 9, 2006
Sold by
Patch Jonathan D and Patch Margaret K
Bought by
Shah Kartik and Shah Nimisha
Current Estimated Value
Purchase Details
Closed on
Nov 12, 1999
Sold by
Clausen Christian Fred and Clausen Shirley
Bought by
Patch Jonathan D and Patch Margaret K
Home Financials for this Owner
Home Financials are based on the most recent Mortgage that was taken out on this home.
Original Mortgage
$207,400
Interest Rate
7.68%
Mortgage Type
Commercial
Purchase Details
Closed on
Sep 13, 1991
Sold by
Graham Richard and Rafferty Ann M
Bought by
Clausen Christian F and Clausen Shirley
Create a Home Valuation Report for This Property
The Home Valuation Report is an in-depth analysis detailing your home's value as well as a comparison with similar homes in the area
Home Values in the Area
Average Home Value in this Area
Purchase History
| Date | Buyer | Sale Price | Title Company |
|---|---|---|---|
| Shah Kartik | $354,000 | -- | |
| Shah Kartik | $354,000 | -- | |
| Patch Jonathan D | $244,000 | -- | |
| Patch Jonathan D | $244,000 | -- | |
| Clausen Christian F | $120,000 | -- |
Source: Public Records
Mortgage History
| Date | Status | Borrower | Loan Amount |
|---|---|---|---|
| Previous Owner | Clausen Christian F | $207,400 |
Source: Public Records
Tax History Compared to Growth
Tax History
| Year | Tax Paid | Tax Assessment Tax Assessment Total Assessment is a certain percentage of the fair market value that is determined by local assessors to be the total taxable value of land and additions on the property. | Land | Improvement |
|---|---|---|---|---|
| 2025 | $8,047 | $564,700 | $286,000 | $278,700 |
| 2024 | $7,666 | $536,800 | $254,500 | $282,300 |
| 2023 | $7,479 | $505,700 | $240,200 | $265,500 |
| 2022 | $7,912 | $479,800 | $228,800 | $251,000 |
| 2021 | $8,153 | $476,200 | $228,800 | $247,400 |
| 2020 | $8,123 | $470,900 | $228,800 | $242,100 |
| 2019 | $7,633 | $445,100 | $205,900 | $239,200 |
| 2018 | $7,521 | $432,500 | $201,300 | $231,200 |
| 2017 | $7,453 | $428,600 | $201,400 | $227,200 |
| 2016 | $7,359 | $428,600 | $201,400 | $227,200 |
| 2015 | $6,868 | $410,500 | $203,100 | $207,400 |
| 2014 | $6,483 | $390,800 | $203,100 | $187,700 |
Source: Public Records
Map
Nearby Homes
- 26 Maple St
- 6 Silas Dr
- 6 Vanessa Dr
- 85 Hudson St Unit 85
- 14 Vanessa Dr
- 13 Deacon St
- 59 School St Unit A-14
- 5 Swan View Common Dr
- 86 Whitney St
- 71 Summer St
- 129 Bartlett St
- 90 W Main St
- 89 W Main St
- 39 Pleasant St Unit B19
- 39 Pleasant St Unit C5
- 132 W Main St
- 19 Crestwood Dr Unit 19
- 185-187 South St
- 460 Whitney St
- 107 Washburn St