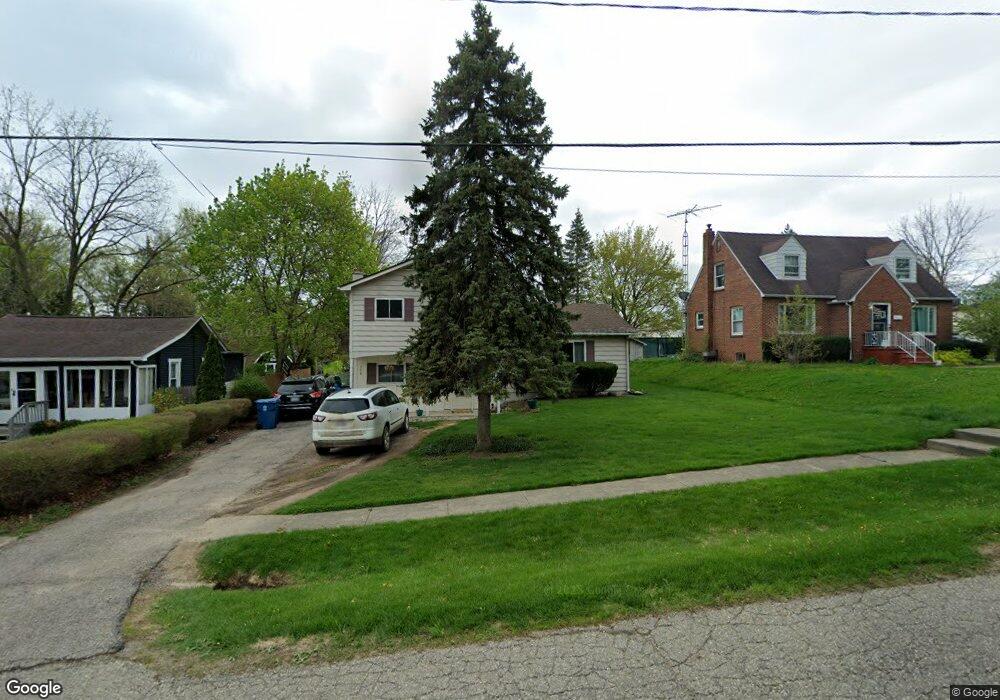
158 Mcfarland St Grand Blanc, MI 48439
Estimated Value: $187,000 - $224,000
3
Beds
2
Baths
1,520
Sq Ft
$138/Sq Ft
Est. Value
About This Home
This home is located at 158 Mcfarland St, Grand Blanc, MI 48439 and is currently estimated at $209,078, approximately $137 per square foot. 158 Mcfarland St is a home located in Genesee County with nearby schools including Indian Hill Elementary School, Grand Blanc East Middle School, and Grand Blanc High School.
Ownership History
Date
Name
Owned For
Owner Type
Purchase Details
Closed on
Sep 30, 2021
Sold by
Baldridge Heather M
Bought by
Pratt Caitlin M
Current Estimated Value
Home Financials for this Owner
Home Financials are based on the most recent Mortgage that was taken out on this home.
Original Mortgage
$6,193
Interest Rate
2.8%
Mortgage Type
New Conventional
Purchase Details
Closed on
Feb 20, 2013
Sold by
Baldridge Adam
Bought by
Baldridge Heather M
Purchase Details
Closed on
Aug 1, 2003
Sold by
Enicks Lori J
Bought by
Baldridge Adam and Baldridge Heather M
Purchase Details
Closed on
Oct 22, 1999
Sold by
Hackett Arthur
Bought by
Enicks Lori J
Home Financials for this Owner
Home Financials are based on the most recent Mortgage that was taken out on this home.
Original Mortgage
$111,800
Interest Rate
7.87%
Mortgage Type
FHA
Create a Home Valuation Report for This Property
The Home Valuation Report is an in-depth analysis detailing your home's value as well as a comparison with similar homes in the area
Home Values in the Area
Average Home Value in this Area
Purchase History
| Date | Buyer | Sale Price | Title Company |
|---|---|---|---|
| Pratt Caitlin M | $134,900 | Liberty Title | |
| Pratt Caitlin M | $134,900 | Liberty Title | |
| Baldridge Heather M | -- | Lighthouse Title Inc | |
| Baldridge Adam | $128,900 | Sargents Title Company | |
| Enicks Lori J | $111,900 | First American Title Ins Co |
Source: Public Records
Mortgage History
| Date | Status | Borrower | Loan Amount |
|---|---|---|---|
| Closed | Pratt Caitlin M | $6,193 | |
| Open | Pratt Caitlin M | $132,456 | |
| Previous Owner | Enicks Lori J | $111,800 |
Source: Public Records
Tax History Compared to Growth
Tax History
| Year | Tax Paid | Tax Assessment Tax Assessment Total Assessment is a certain percentage of the fair market value that is determined by local assessors to be the total taxable value of land and additions on the property. | Land | Improvement |
|---|---|---|---|---|
| 2025 | $2,745 | $84,600 | $0 | $0 |
| 2024 | $2,265 | $76,500 | $0 | $0 |
| 2023 | $2,160 | $65,700 | $0 | $0 |
| 2022 | $2,382 | $55,500 | $0 | $0 |
| 2021 | $2,143 | $51,500 | $0 | $0 |
| 2020 | $1,912 | $48,900 | $0 | $0 |
| 2019 | $3,617 | $46,500 | $0 | $0 |
| 2018 | $253 | $46,500 | $0 | $0 |
| 2017 | $1,920 | $43,300 | $0 | $0 |
| 2016 | $1,903 | $38,700 | $0 | $0 |
| 2015 | $1,837 | $33,800 | $0 | $0 |
| 2014 | -- | $30,900 | $0 | $0 |
| 2012 | -- | $30,700 | $30,700 | $0 |
Source: Public Records
Map
Nearby Homes
- 11026 Walker St
- 11319 S Saginaw St
- 11166 Riverview Dr
- 130 Reid Rd
- 11601 Hazel Ave
- 11106 Woodbridge Dr
- 4142 Oak St Unit 16
- 527 Greenwich Ln
- 200 Grant St
- 11348 Kingsley Dr
- 4062 Oak St
- 4241 Cedar Ln
- 4249 Cedar Ln
- 4233 Cedar Ln
- 4257 Cedar Ln
- 4246 Cedar Ln
- 4294 Oak St
- 11635 S Saginaw St
- 3 Lots S Saginaw St
- Vac S Saginaw St
- 152 Mcfarland St
- 212 Mcfarland St
- 138 Mcfarland St
- 144 Mcfarland St
- 207 Mcfarland St
- 218 Mcfarland St
- 11035 Walker St
- 132 Mcfarland St
- 137 Pleasantview Dr
- 226 Mcfarland St
- 11225 S Saginaw St
- 11225 S Saginaw St Unit H
- 11225 S Saginaw St Unit F
- 11225 S Saginaw St
- 11225 S Saginaw St Unit C
- 11225 S Saginaw St Unit 950
- 11225 S Saginaw St Unit 2200
- 11225 S Saginaw St Unit 1000
- 11225 S Saginaw St Unit D
- 11225 S Saginaw St Unit B