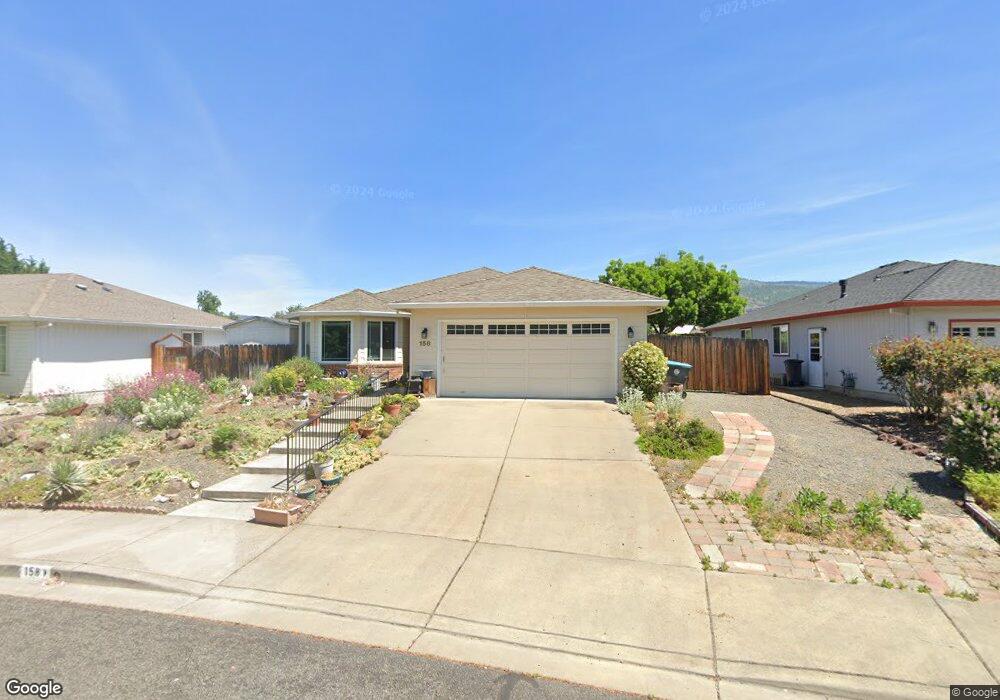
158 Meadow View Dr Phoenix, OR 97535
Estimated Value: $366,881 - $445,000
3
Beds
2
Baths
1,505
Sq Ft
$276/Sq Ft
Est. Value
About This Home
This home is located at 158 Meadow View Dr, Phoenix, OR 97535 and is currently estimated at $414,970, approximately $275 per square foot. 158 Meadow View Dr is a home located in Jackson County with nearby schools including Orchard Hill Elementary School, Talent Middle School, and Phoenix High School.
Ownership History
Date
Name
Owned For
Owner Type
Purchase Details
Closed on
Aug 28, 2025
Sold by
Mje Investments Llc
Bought by
Margaret A Cochrane Revocable Trust and Cochrane
Current Estimated Value
Home Financials for this Owner
Home Financials are based on the most recent Mortgage that was taken out on this home.
Original Mortgage
$295,000
Outstanding Balance
$295,000
Interest Rate
6.75%
Mortgage Type
New Conventional
Estimated Equity
$119,970
Purchase Details
Closed on
Jan 9, 2025
Sold by
Debritto Janise E
Bought by
Mje Investments Llc
Purchase Details
Closed on
Sep 11, 2006
Sold by
Hutchinson Herman and Hutchinson Dolores
Bought by
Debritto Carlos and Debritto Janise E
Home Financials for this Owner
Home Financials are based on the most recent Mortgage that was taken out on this home.
Original Mortgage
$248,000
Interest Rate
6.56%
Mortgage Type
Purchase Money Mortgage
Purchase Details
Closed on
Feb 26, 1998
Sold by
Trocker Monica M and Winnifred E Trocker Revocable
Bought by
Hutchinson Herman and Hutchinson Dolores
Home Financials for this Owner
Home Financials are based on the most recent Mortgage that was taken out on this home.
Original Mortgage
$69,500
Interest Rate
6.99%
Mortgage Type
Seller Take Back
Create a Home Valuation Report for This Property
The Home Valuation Report is an in-depth analysis detailing your home's value as well as a comparison with similar homes in the area
Home Values in the Area
Average Home Value in this Area
Purchase History
| Date | Buyer | Sale Price | Title Company |
|---|---|---|---|
| Margaret A Cochrane Revocable Trust | $395,000 | Ticor Title | |
| Mje Investments Llc | $285,000 | Ticor Title | |
| Debritto Carlos | $310,000 | Lawyers Title Ins | |
| Hutchinson Herman | $139,000 | Jackson County Title |
Source: Public Records
Mortgage History
| Date | Status | Borrower | Loan Amount |
|---|---|---|---|
| Open | Margaret A Cochrane Revocable Trust | $295,000 | |
| Previous Owner | Debritto Carlos | $248,000 | |
| Previous Owner | Hutchinson Herman | $69,500 |
Source: Public Records
Tax History Compared to Growth
Tax History
| Year | Tax Paid | Tax Assessment Tax Assessment Total Assessment is a certain percentage of the fair market value that is determined by local assessors to be the total taxable value of land and additions on the property. | Land | Improvement |
|---|---|---|---|---|
| 2025 | $4,194 | $261,530 | $85,520 | $176,010 |
| 2024 | $4,194 | $253,920 | $83,030 | $170,890 |
| 2023 | $4,062 | $246,530 | $80,610 | $165,920 |
| 2022 | $3,954 | $246,530 | $80,610 | $165,920 |
| 2021 | $3,860 | $239,350 | $78,260 | $161,090 |
| 2020 | $3,739 | $232,380 | $75,980 | $156,400 |
| 2019 | $3,639 | $219,050 | $71,610 | $147,440 |
| 2018 | $3,532 | $212,670 | $69,530 | $143,140 |
| 2017 | $3,337 | $212,670 | $69,530 | $143,140 |
| 2016 | $3,247 | $200,470 | $65,540 | $134,930 |
| 2015 | $3,120 | $200,470 | $78,870 | $121,600 |
| 2014 | $3,003 | $188,980 | $74,340 | $114,640 |
Source: Public Records
Map
Nearby Homes
- 110 Freshwater Dr
- 106 Freshwater Dr Unit 2
- 317 Phoenix Hills Dr
- 300 Luman Rd Unit 205
- 4119 S Pacific Hwy
- 3015 Marigold Ln
- 111 E 1st St
- 133 S Main St
- 4601 S Pacific Hwy Unit 3
- 404 Oak St
- 510 N Main St
- 4729 S Pacific Hwy Unit 14
- 4729 S Pacific Hwy Unit 4
- 454 Elm St
- 612 N Main St
- 4624 S Pacific Hwy Unit 61
- 201 S Rose St
- 309 W 1st St
- 137 N Phoenix Rd
- 817 Amerman Dr
- 152 Meadow View Dr
- 160 Meadow View Dr
- 148 Meadow View Dr
- 164 Meadow View Dr
- 153 Meadow View Dr
- 168 Meadow View Dr
- 149 Meadow View Dr
- 144 Meadow View Dr
- 145 Meadow View Dr
- 172 Meadow View Dr
- 141 Meadow View Dr
- 140 Meadow View Dr
- 112 Vail Ct
- 176 Meadow View Dr
- 172 Meadowview Dr
- 180 Meadow View Dr
- 120 Freshwater Dr
- 136 Meadow View Dr
- 4280 Fern Valley Rd
- 120 Freshwater Dr